Immigrants from Burma/Myanmar vs Immigrants from Netherlands Vision Disability
COMPARE
Immigrants from Burma/Myanmar
Immigrants from Netherlands
Vision Disability
Vision Disability Comparison
Immigrants from Burma/Myanmar
Immigrants from Netherlands
2.2%
VISION DISABILITY
37.9/ 100
METRIC RATING
183rd/ 347
METRIC RANK
2.1%
VISION DISABILITY
84.2/ 100
METRIC RATING
140th/ 347
METRIC RANK
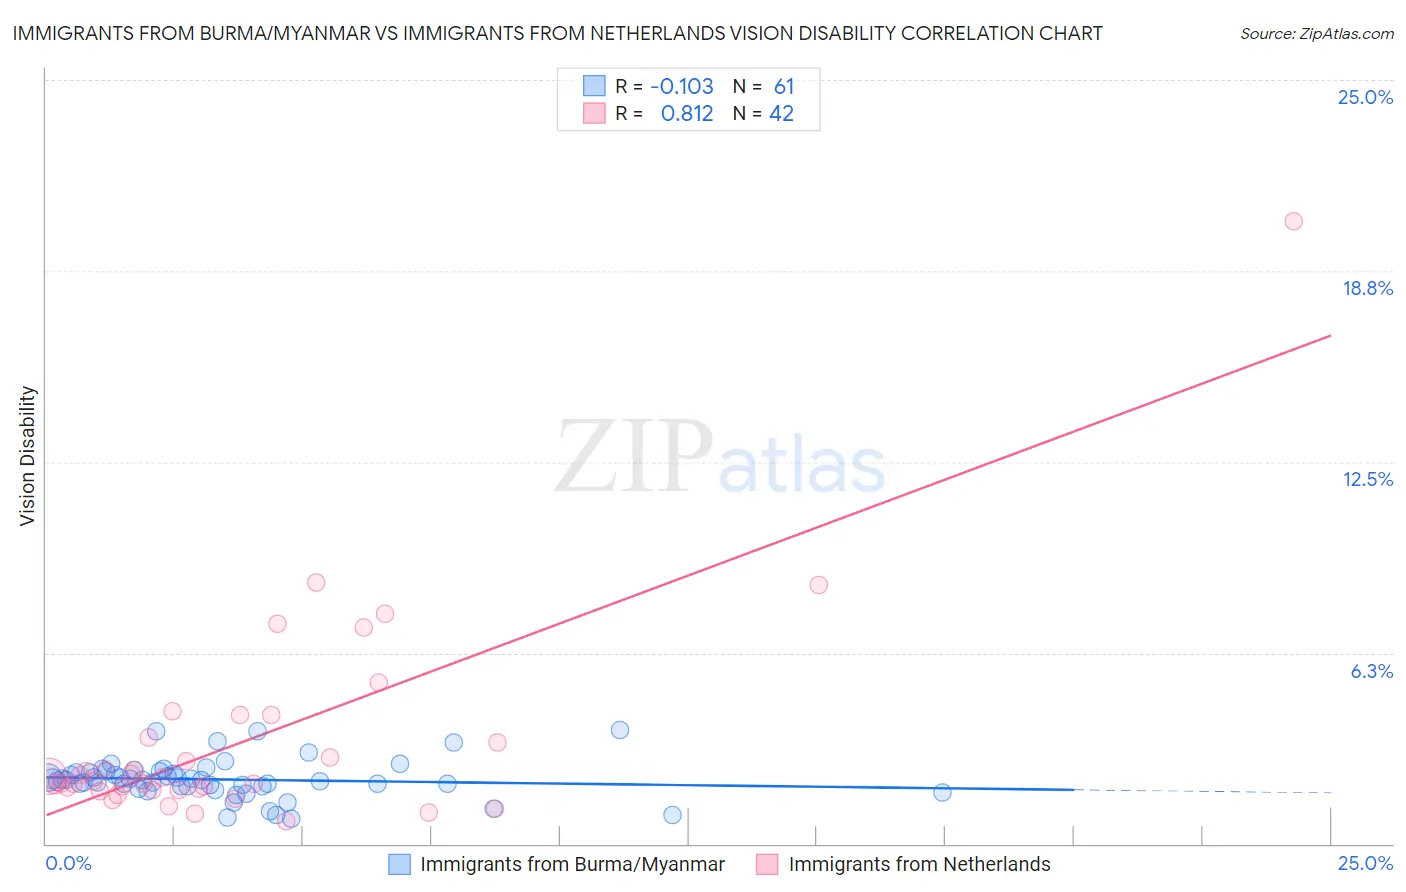
Immigrants from Burma/Myanmar vs Immigrants from Netherlands Vision Disability Correlation Chart
The statistical analysis conducted on geographies consisting of 172,315,861 people shows a poor negative correlation between the proportion of Immigrants from Burma/Myanmar and percentage of population with vision disability in the United States with a correlation coefficient (R) of -0.103 and weighted average of 2.2%. Similarly, the statistical analysis conducted on geographies consisting of 237,808,259 people shows a very strong positive correlation between the proportion of Immigrants from Netherlands and percentage of population with vision disability in the United States with a correlation coefficient (R) of 0.812 and weighted average of 2.1%, a difference of 3.5%.
Vision Disability Correlation Summary
| Measurement | Immigrants from Burma/Myanmar | Immigrants from Netherlands |
| Minimum | 0.83% | 0.76% |
| Maximum | 3.7% | 20.4% |
| Range | 2.9% | 19.6% |
| Mean | 2.1% | 3.3% |
| Median | 2.1% | 2.1% |
| Interquartile 25% (IQ1) | 1.9% | 1.8% |
| Interquartile 75% (IQ3) | 2.3% | 3.5% |
| Interquartile Range (IQR) | 0.47% | 1.7% |
| Standard Deviation (Sample) | 0.62% | 3.4% |
| Standard Deviation (Population) | 0.62% | 3.3% |
Similar Demographics by Vision Disability
Demographics Similar to Immigrants from Burma/Myanmar by Vision Disability
In terms of vision disability, the demographic groups most similar to Immigrants from Burma/Myanmar are Moroccan (2.2%, a difference of 0.17%), Costa Rican (2.2%, a difference of 0.19%), Immigrants from Western Europe (2.2%, a difference of 0.21%), Immigrants from Middle Africa (2.2%, a difference of 0.30%), and Uruguayan (2.2%, a difference of 0.31%).
| Demographics | Rating | Rank | Vision Disability |
| Yugoslavians | 46.5 /100 | #176 | Average 2.2% |
| Slavs | 46.0 /100 | #177 | Average 2.2% |
| Immigrants | Oceania | 45.1 /100 | #178 | Average 2.2% |
| Immigrants | North America | 44.5 /100 | #179 | Average 2.2% |
| Uruguayans | 42.7 /100 | #180 | Average 2.2% |
| Immigrants | Western Europe | 41.1 /100 | #181 | Average 2.2% |
| Costa Ricans | 40.7 /100 | #182 | Average 2.2% |
| Immigrants | Burma/Myanmar | 37.9 /100 | #183 | Fair 2.2% |
| Moroccans | 35.4 /100 | #184 | Fair 2.2% |
| Immigrants | Middle Africa | 33.5 /100 | #185 | Fair 2.2% |
| Native Hawaiians | 33.3 /100 | #186 | Fair 2.2% |
| Immigrants | St. Vincent and the Grenadines | 30.3 /100 | #187 | Fair 2.2% |
| Guyanese | 28.9 /100 | #188 | Fair 2.2% |
| Salvadorans | 27.4 /100 | #189 | Fair 2.2% |
| Immigrants | Costa Rica | 26.1 /100 | #190 | Fair 2.2% |
Demographics Similar to Immigrants from Netherlands by Vision Disability
In terms of vision disability, the demographic groups most similar to Immigrants from Netherlands are Sierra Leonean (2.1%, a difference of 0.010%), Immigrants from Morocco (2.1%, a difference of 0.13%), South American (2.1%, a difference of 0.16%), Immigrants from Sierra Leone (2.1%, a difference of 0.16%), and Ukrainian (2.1%, a difference of 0.26%).
| Demographics | Rating | Rank | Vision Disability |
| Syrians | 87.5 /100 | #133 | Excellent 2.1% |
| Venezuelans | 87.2 /100 | #134 | Excellent 2.1% |
| Vietnamese | 86.7 /100 | #135 | Excellent 2.1% |
| Czechs | 86.3 /100 | #136 | Excellent 2.1% |
| Immigrants | South Eastern Asia | 86.3 /100 | #137 | Excellent 2.1% |
| Arabs | 86.3 /100 | #138 | Excellent 2.1% |
| Immigrants | Morocco | 85.2 /100 | #139 | Excellent 2.1% |
| Immigrants | Netherlands | 84.2 /100 | #140 | Excellent 2.1% |
| Sierra Leoneans | 84.1 /100 | #141 | Excellent 2.1% |
| South Americans | 82.8 /100 | #142 | Excellent 2.1% |
| Immigrants | Sierra Leone | 82.8 /100 | #143 | Excellent 2.1% |
| Ukrainians | 81.9 /100 | #144 | Excellent 2.1% |
| Immigrants | Bosnia and Herzegovina | 81.5 /100 | #145 | Excellent 2.1% |
| Italians | 79.7 /100 | #146 | Good 2.1% |
| Immigrants | Sudan | 78.4 /100 | #147 | Good 2.1% |