Immigrants from Burma/Myanmar vs Immigrants from Uruguay Median Female Earnings
COMPARE
Immigrants from Burma/Myanmar
Immigrants from Uruguay
Median Female Earnings
Median Female Earnings Comparison
Immigrants from Burma/Myanmar
Immigrants from Uruguay
$38,028
MEDIAN FEMALE EARNINGS
3.0/ 100
METRIC RATING
242nd/ 347
METRIC RANK
$38,945
MEDIAN FEMALE EARNINGS
17.3/ 100
METRIC RATING
204th/ 347
METRIC RANK
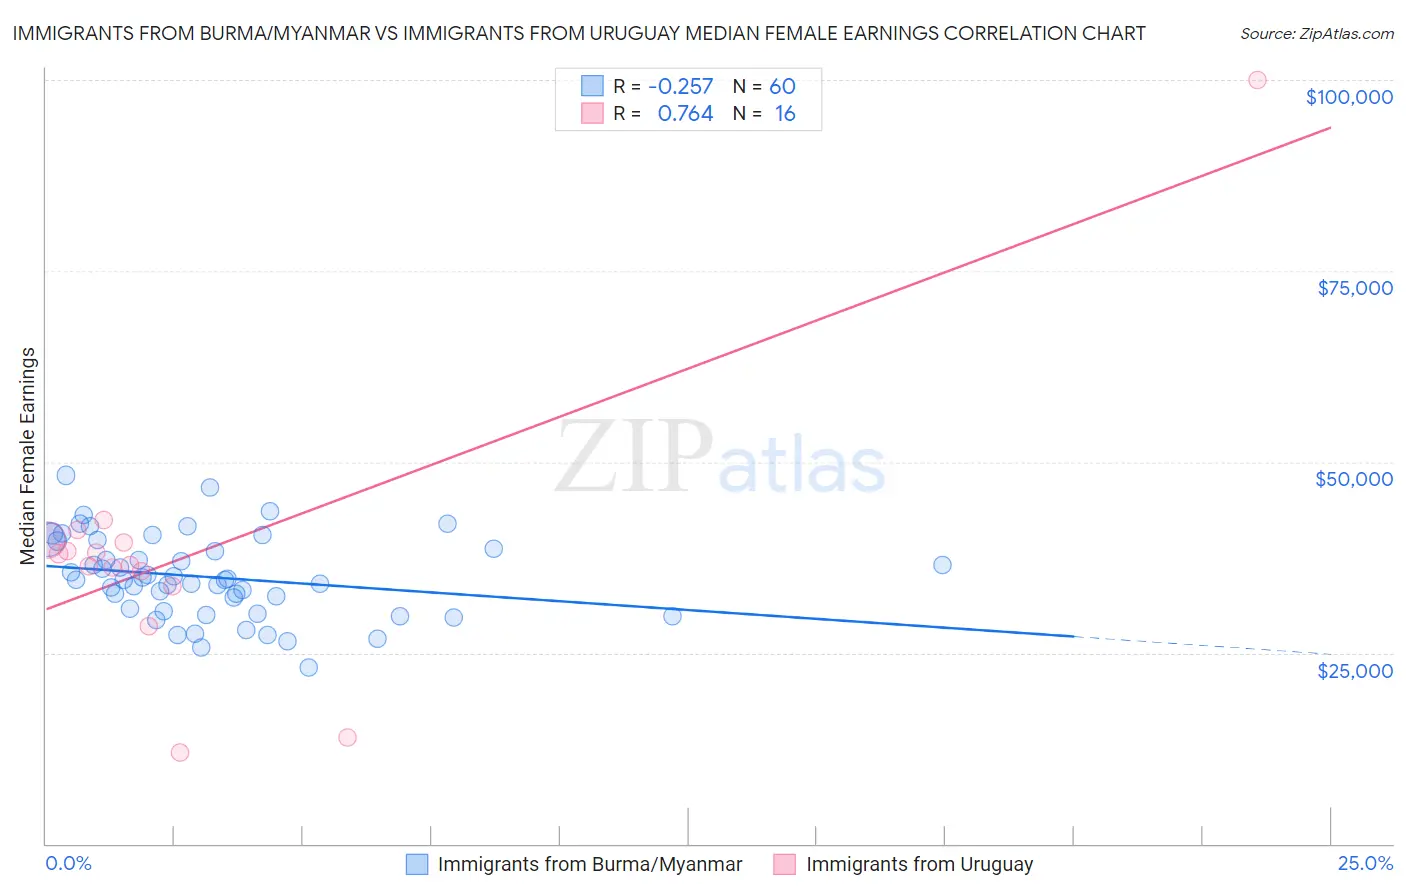
Immigrants from Burma/Myanmar vs Immigrants from Uruguay Median Female Earnings Correlation Chart
The statistical analysis conducted on geographies consisting of 172,347,432 people shows a weak negative correlation between the proportion of Immigrants from Burma/Myanmar and median female earnings in the United States with a correlation coefficient (R) of -0.257 and weighted average of $38,028. Similarly, the statistical analysis conducted on geographies consisting of 133,253,998 people shows a strong positive correlation between the proportion of Immigrants from Uruguay and median female earnings in the United States with a correlation coefficient (R) of 0.764 and weighted average of $38,945, a difference of 2.4%.
Median Female Earnings Correlation Summary
| Measurement | Immigrants from Burma/Myanmar | Immigrants from Uruguay |
| Minimum | $23,125 | $12,017 |
| Maximum | $48,239 | $100,000 |
| Range | $25,114 | $87,983 |
| Mean | $34,892 | $38,117 |
| Median | $34,545 | $37,217 |
| Interquartile 25% (IQ1) | $30,606 | $34,685 |
| Interquartile 75% (IQ3) | $39,132 | $39,605 |
| Interquartile Range (IQR) | $8,525 | $4,920 |
| Standard Deviation (Sample) | $5,366 | $18,714 |
| Standard Deviation (Population) | $5,321 | $18,119 |
Similar Demographics by Median Female Earnings
Demographics Similar to Immigrants from Burma/Myanmar by Median Female Earnings
In terms of median female earnings, the demographic groups most similar to Immigrants from Burma/Myanmar are German ($37,986, a difference of 0.11%), Immigrants from Liberia ($37,970, a difference of 0.15%), Immigrants from Middle Africa ($37,965, a difference of 0.17%), Delaware ($37,964, a difference of 0.17%), and Spanish ($38,098, a difference of 0.18%).
| Demographics | Rating | Rank | Median Female Earnings |
| Sudanese | 4.4 /100 | #235 | Tragic $38,215 |
| Liberians | 4.4 /100 | #236 | Tragic $38,215 |
| Immigrants | Cabo Verde | 4.3 /100 | #237 | Tragic $38,208 |
| Alaska Natives | 4.3 /100 | #238 | Tragic $38,202 |
| English | 4.2 /100 | #239 | Tragic $38,196 |
| Finns | 4.0 /100 | #240 | Tragic $38,173 |
| Spanish | 3.5 /100 | #241 | Tragic $38,098 |
| Immigrants | Burma/Myanmar | 3.0 /100 | #242 | Tragic $38,028 |
| Germans | 2.8 /100 | #243 | Tragic $37,986 |
| Immigrants | Liberia | 2.7 /100 | #244 | Tragic $37,970 |
| Immigrants | Middle Africa | 2.7 /100 | #245 | Tragic $37,965 |
| Delaware | 2.6 /100 | #246 | Tragic $37,964 |
| Immigrants | Somalia | 2.4 /100 | #247 | Tragic $37,914 |
| Alaskan Athabascans | 2.3 /100 | #248 | Tragic $37,905 |
| Swiss | 2.3 /100 | #249 | Tragic $37,904 |
Demographics Similar to Immigrants from Uruguay by Median Female Earnings
In terms of median female earnings, the demographic groups most similar to Immigrants from Uruguay are Immigrants from Colombia ($38,913, a difference of 0.080%), Czech ($38,992, a difference of 0.12%), Immigrants from Bosnia and Herzegovina ($38,886, a difference of 0.15%), Slovak ($39,029, a difference of 0.22%), and Immigrants from Panama ($39,049, a difference of 0.27%).
| Demographics | Rating | Rank | Median Female Earnings |
| Assyrians/Chaldeans/Syriacs | 24.6 /100 | #197 | Fair $39,159 |
| Ecuadorians | 23.0 /100 | #198 | Fair $39,117 |
| Icelanders | 22.7 /100 | #199 | Fair $39,109 |
| Immigrants | Panama | 20.6 /100 | #200 | Fair $39,049 |
| Panamanians | 20.6 /100 | #201 | Fair $39,049 |
| Slovaks | 19.9 /100 | #202 | Poor $39,029 |
| Czechs | 18.7 /100 | #203 | Poor $38,992 |
| Immigrants | Uruguay | 17.3 /100 | #204 | Poor $38,945 |
| Immigrants | Colombia | 16.3 /100 | #205 | Poor $38,913 |
| Immigrants | Bosnia and Herzegovina | 15.6 /100 | #206 | Poor $38,886 |
| Immigrants | Cambodia | 14.2 /100 | #207 | Poor $38,833 |
| Immigrants | Thailand | 13.6 /100 | #208 | Poor $38,810 |
| Norwegians | 13.4 /100 | #209 | Poor $38,802 |
| Czechoslovakians | 12.0 /100 | #210 | Poor $38,738 |
| Aleuts | 11.6 /100 | #211 | Poor $38,719 |