Immigrants from Burma/Myanmar vs Bulgarian Median Female Earnings
COMPARE
Immigrants from Burma/Myanmar
Bulgarian
Median Female Earnings
Median Female Earnings Comparison
Immigrants from Burma/Myanmar
Bulgarians
$38,028
MEDIAN FEMALE EARNINGS
3.0/ 100
METRIC RATING
242nd/ 347
METRIC RANK
$43,638
MEDIAN FEMALE EARNINGS
100.0/ 100
METRIC RATING
43rd/ 347
METRIC RANK
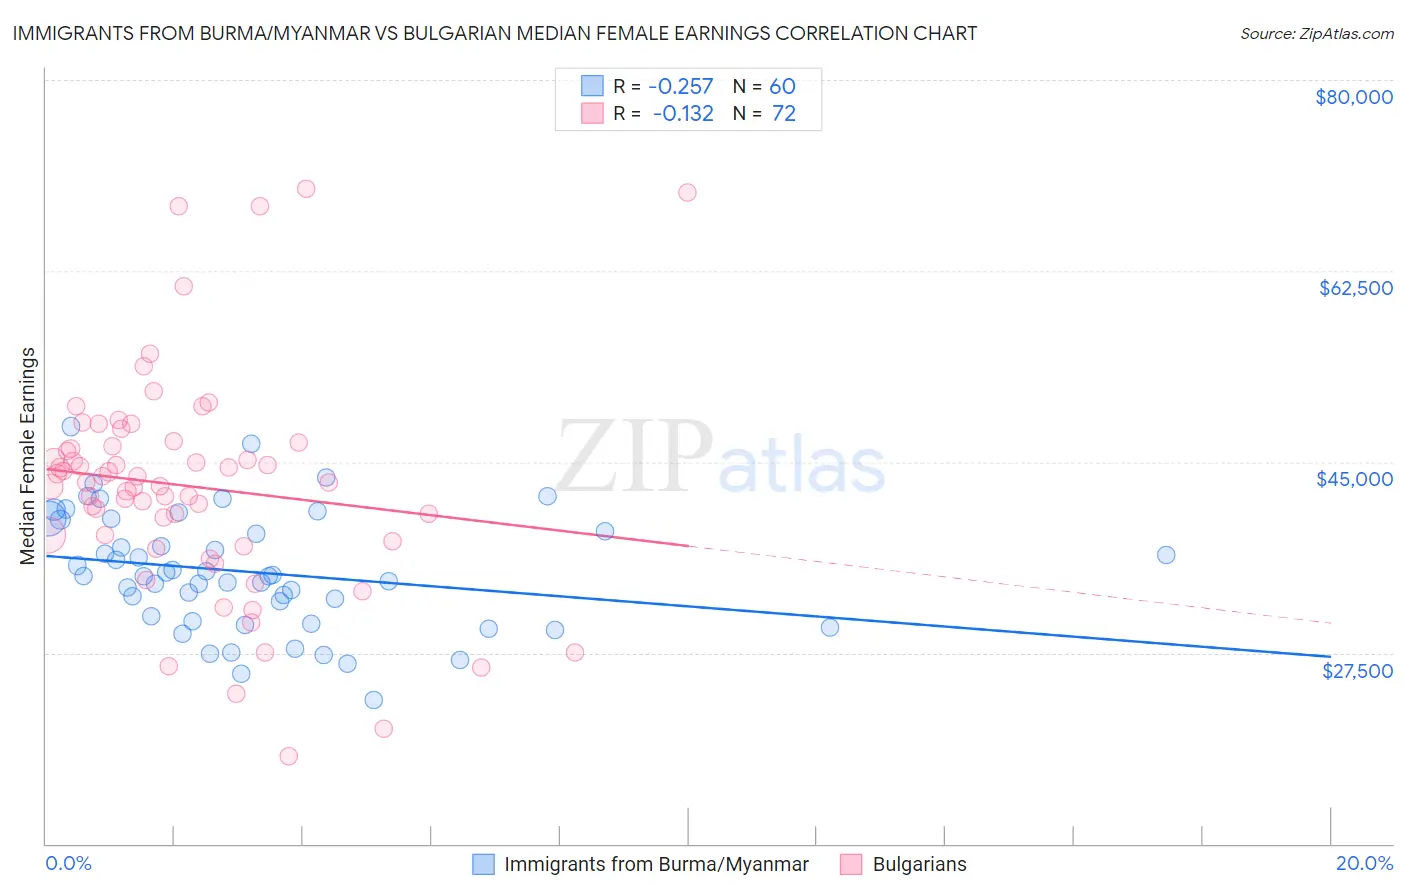
Immigrants from Burma/Myanmar vs Bulgarian Median Female Earnings Correlation Chart
The statistical analysis conducted on geographies consisting of 172,347,432 people shows a weak negative correlation between the proportion of Immigrants from Burma/Myanmar and median female earnings in the United States with a correlation coefficient (R) of -0.257 and weighted average of $38,028. Similarly, the statistical analysis conducted on geographies consisting of 205,601,132 people shows a poor negative correlation between the proportion of Bulgarians and median female earnings in the United States with a correlation coefficient (R) of -0.132 and weighted average of $43,638, a difference of 14.7%.
Median Female Earnings Correlation Summary
| Measurement | Immigrants from Burma/Myanmar | Bulgarian |
| Minimum | $23,125 | $18,066 |
| Maximum | $48,239 | $70,060 |
| Range | $25,114 | $51,994 |
| Mean | $34,892 | $42,770 |
| Median | $34,545 | $43,122 |
| Interquartile 25% (IQ1) | $30,606 | $37,998 |
| Interquartile 75% (IQ3) | $39,132 | $46,606 |
| Interquartile Range (IQR) | $8,525 | $8,608 |
| Standard Deviation (Sample) | $5,366 | $10,148 |
| Standard Deviation (Population) | $5,321 | $10,078 |
Similar Demographics by Median Female Earnings
Demographics Similar to Immigrants from Burma/Myanmar by Median Female Earnings
In terms of median female earnings, the demographic groups most similar to Immigrants from Burma/Myanmar are German ($37,986, a difference of 0.11%), Immigrants from Liberia ($37,970, a difference of 0.15%), Immigrants from Middle Africa ($37,965, a difference of 0.17%), Delaware ($37,964, a difference of 0.17%), and Spanish ($38,098, a difference of 0.18%).
| Demographics | Rating | Rank | Median Female Earnings |
| Sudanese | 4.4 /100 | #235 | Tragic $38,215 |
| Liberians | 4.4 /100 | #236 | Tragic $38,215 |
| Immigrants | Cabo Verde | 4.3 /100 | #237 | Tragic $38,208 |
| Alaska Natives | 4.3 /100 | #238 | Tragic $38,202 |
| English | 4.2 /100 | #239 | Tragic $38,196 |
| Finns | 4.0 /100 | #240 | Tragic $38,173 |
| Spanish | 3.5 /100 | #241 | Tragic $38,098 |
| Immigrants | Burma/Myanmar | 3.0 /100 | #242 | Tragic $38,028 |
| Germans | 2.8 /100 | #243 | Tragic $37,986 |
| Immigrants | Liberia | 2.7 /100 | #244 | Tragic $37,970 |
| Immigrants | Middle Africa | 2.7 /100 | #245 | Tragic $37,965 |
| Delaware | 2.6 /100 | #246 | Tragic $37,964 |
| Immigrants | Somalia | 2.4 /100 | #247 | Tragic $37,914 |
| Alaskan Athabascans | 2.3 /100 | #248 | Tragic $37,905 |
| Swiss | 2.3 /100 | #249 | Tragic $37,904 |
Demographics Similar to Bulgarians by Median Female Earnings
In terms of median female earnings, the demographic groups most similar to Bulgarians are Bhutanese ($43,648, a difference of 0.020%), Immigrants from Denmark ($43,646, a difference of 0.020%), Immigrants from Czechoslovakia ($43,571, a difference of 0.15%), Immigrants from Europe ($43,523, a difference of 0.26%), and Immigrants from Bolivia ($43,467, a difference of 0.39%).
| Demographics | Rating | Rank | Median Female Earnings |
| Immigrants | Turkey | 100.0 /100 | #36 | Exceptional $44,066 |
| Immigrants | Switzerland | 100.0 /100 | #37 | Exceptional $43,996 |
| Latvians | 100.0 /100 | #38 | Exceptional $43,941 |
| Israelis | 100.0 /100 | #39 | Exceptional $43,852 |
| Immigrants | Malaysia | 100.0 /100 | #40 | Exceptional $43,835 |
| Bhutanese | 100.0 /100 | #41 | Exceptional $43,648 |
| Immigrants | Denmark | 100.0 /100 | #42 | Exceptional $43,646 |
| Bulgarians | 100.0 /100 | #43 | Exceptional $43,638 |
| Immigrants | Czechoslovakia | 100.0 /100 | #44 | Exceptional $43,571 |
| Immigrants | Europe | 100.0 /100 | #45 | Exceptional $43,523 |
| Immigrants | Bolivia | 100.0 /100 | #46 | Exceptional $43,467 |
| Bolivians | 100.0 /100 | #47 | Exceptional $43,445 |
| Immigrants | Indonesia | 100.0 /100 | #48 | Exceptional $43,412 |
| Immigrants | Serbia | 100.0 /100 | #49 | Exceptional $43,385 |
| Immigrants | Uzbekistan | 100.0 /100 | #50 | Exceptional $43,363 |