Immigrants from Burma/Myanmar vs Afghan Median Female Earnings
COMPARE
Immigrants from Burma/Myanmar
Afghan
Median Female Earnings
Median Female Earnings Comparison
Immigrants from Burma/Myanmar
Afghans
$38,028
MEDIAN FEMALE EARNINGS
3.0/ 100
METRIC RATING
242nd/ 347
METRIC RANK
$43,077
MEDIAN FEMALE EARNINGS
99.9/ 100
METRIC RATING
62nd/ 347
METRIC RANK
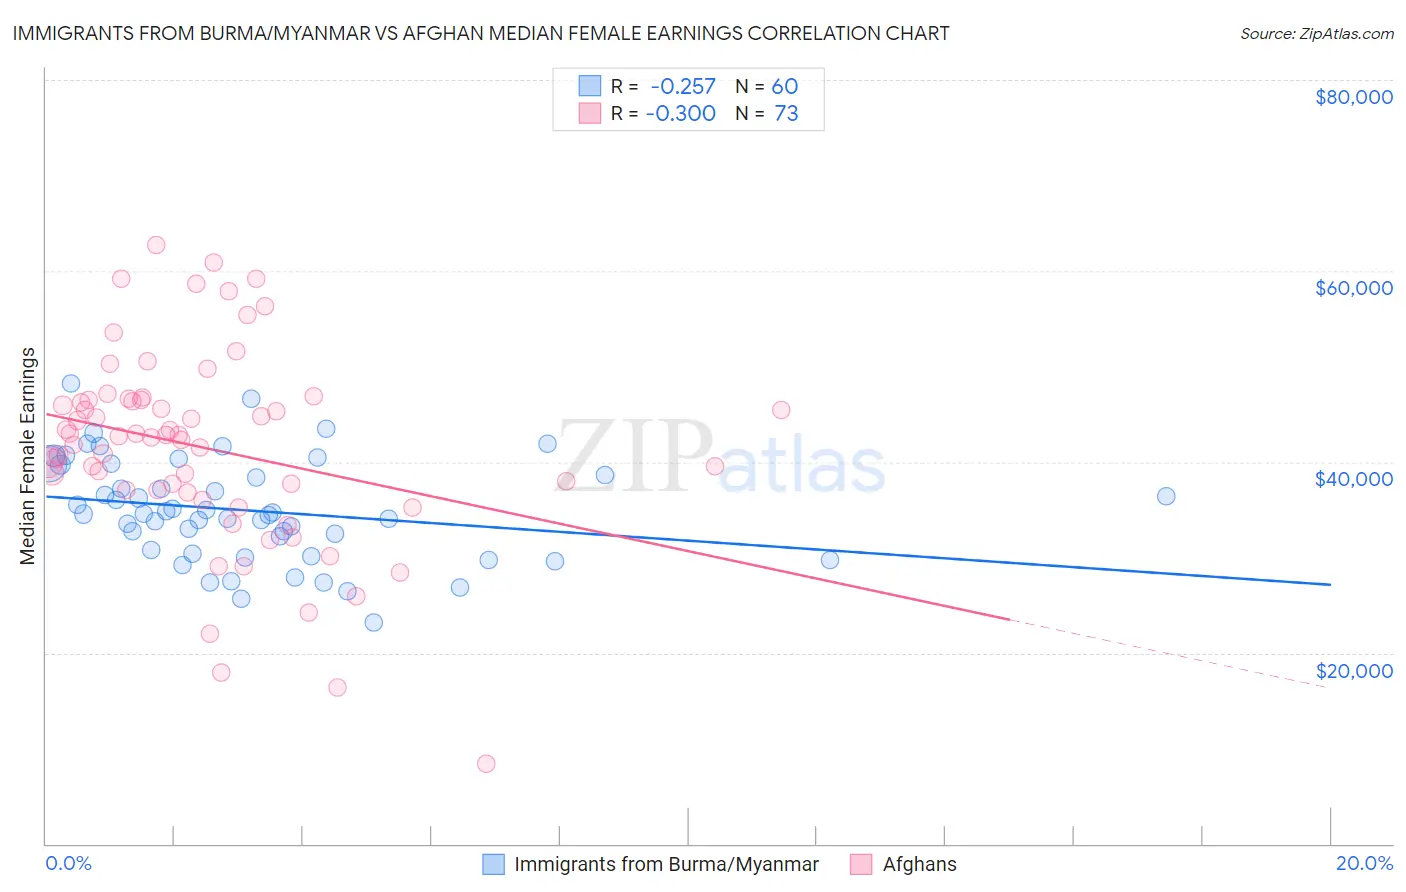
Immigrants from Burma/Myanmar vs Afghan Median Female Earnings Correlation Chart
The statistical analysis conducted on geographies consisting of 172,347,432 people shows a weak negative correlation between the proportion of Immigrants from Burma/Myanmar and median female earnings in the United States with a correlation coefficient (R) of -0.257 and weighted average of $38,028. Similarly, the statistical analysis conducted on geographies consisting of 148,870,057 people shows a mild negative correlation between the proportion of Afghans and median female earnings in the United States with a correlation coefficient (R) of -0.300 and weighted average of $43,077, a difference of 13.3%.
Median Female Earnings Correlation Summary
| Measurement | Immigrants from Burma/Myanmar | Afghan |
| Minimum | $23,125 | $8,380 |
| Maximum | $48,239 | $62,780 |
| Range | $25,114 | $54,400 |
| Mean | $34,892 | $41,426 |
| Median | $34,545 | $42,748 |
| Interquartile 25% (IQ1) | $30,606 | $36,907 |
| Interquartile 75% (IQ3) | $39,132 | $46,506 |
| Interquartile Range (IQR) | $8,525 | $9,599 |
| Standard Deviation (Sample) | $5,366 | $10,289 |
| Standard Deviation (Population) | $5,321 | $10,218 |
Similar Demographics by Median Female Earnings
Demographics Similar to Immigrants from Burma/Myanmar by Median Female Earnings
In terms of median female earnings, the demographic groups most similar to Immigrants from Burma/Myanmar are German ($37,986, a difference of 0.11%), Immigrants from Liberia ($37,970, a difference of 0.15%), Immigrants from Middle Africa ($37,965, a difference of 0.17%), Delaware ($37,964, a difference of 0.17%), and Spanish ($38,098, a difference of 0.18%).
| Demographics | Rating | Rank | Median Female Earnings |
| Sudanese | 4.4 /100 | #235 | Tragic $38,215 |
| Liberians | 4.4 /100 | #236 | Tragic $38,215 |
| Immigrants | Cabo Verde | 4.3 /100 | #237 | Tragic $38,208 |
| Alaska Natives | 4.3 /100 | #238 | Tragic $38,202 |
| English | 4.2 /100 | #239 | Tragic $38,196 |
| Finns | 4.0 /100 | #240 | Tragic $38,173 |
| Spanish | 3.5 /100 | #241 | Tragic $38,098 |
| Immigrants | Burma/Myanmar | 3.0 /100 | #242 | Tragic $38,028 |
| Germans | 2.8 /100 | #243 | Tragic $37,986 |
| Immigrants | Liberia | 2.7 /100 | #244 | Tragic $37,970 |
| Immigrants | Middle Africa | 2.7 /100 | #245 | Tragic $37,965 |
| Delaware | 2.6 /100 | #246 | Tragic $37,964 |
| Immigrants | Somalia | 2.4 /100 | #247 | Tragic $37,914 |
| Alaskan Athabascans | 2.3 /100 | #248 | Tragic $37,905 |
| Swiss | 2.3 /100 | #249 | Tragic $37,904 |
Demographics Similar to Afghans by Median Female Earnings
In terms of median female earnings, the demographic groups most similar to Afghans are Immigrants from Bulgaria ($43,085, a difference of 0.020%), Immigrants from Ukraine ($43,069, a difference of 0.020%), Immigrants from Latvia ($43,099, a difference of 0.050%), Immigrants from Pakistan ($43,052, a difference of 0.060%), and Estonian ($43,106, a difference of 0.070%).
| Demographics | Rating | Rank | Median Female Earnings |
| Egyptians | 99.9 /100 | #55 | Exceptional $43,305 |
| Immigrants | Croatia | 99.9 /100 | #56 | Exceptional $43,258 |
| Ethiopians | 99.9 /100 | #57 | Exceptional $43,243 |
| Paraguayans | 99.9 /100 | #58 | Exceptional $43,173 |
| Estonians | 99.9 /100 | #59 | Exceptional $43,106 |
| Immigrants | Latvia | 99.9 /100 | #60 | Exceptional $43,099 |
| Immigrants | Bulgaria | 99.9 /100 | #61 | Exceptional $43,085 |
| Afghans | 99.9 /100 | #62 | Exceptional $43,077 |
| Immigrants | Ukraine | 99.9 /100 | #63 | Exceptional $43,069 |
| Immigrants | Pakistan | 99.9 /100 | #64 | Exceptional $43,052 |
| Sierra Leoneans | 99.9 /100 | #65 | Exceptional $42,868 |
| Immigrants | Norway | 99.9 /100 | #66 | Exceptional $42,837 |
| Immigrants | Egypt | 99.9 /100 | #67 | Exceptional $42,837 |
| Immigrants | Austria | 99.8 /100 | #68 | Exceptional $42,824 |
| Immigrants | Spain | 99.8 /100 | #69 | Exceptional $42,815 |