Immigrants from Burma/Myanmar vs Immigrants from Netherlands Single Male Poverty
COMPARE
Immigrants from Burma/Myanmar
Immigrants from Netherlands
Single Male Poverty
Single Male Poverty Comparison
Immigrants from Burma/Myanmar
Immigrants from Netherlands
13.1%
SINGLE MALE POVERTY
12.6/ 100
METRIC RATING
219th/ 347
METRIC RANK
12.5%
SINGLE MALE POVERTY
86.2/ 100
METRIC RATING
127th/ 347
METRIC RANK
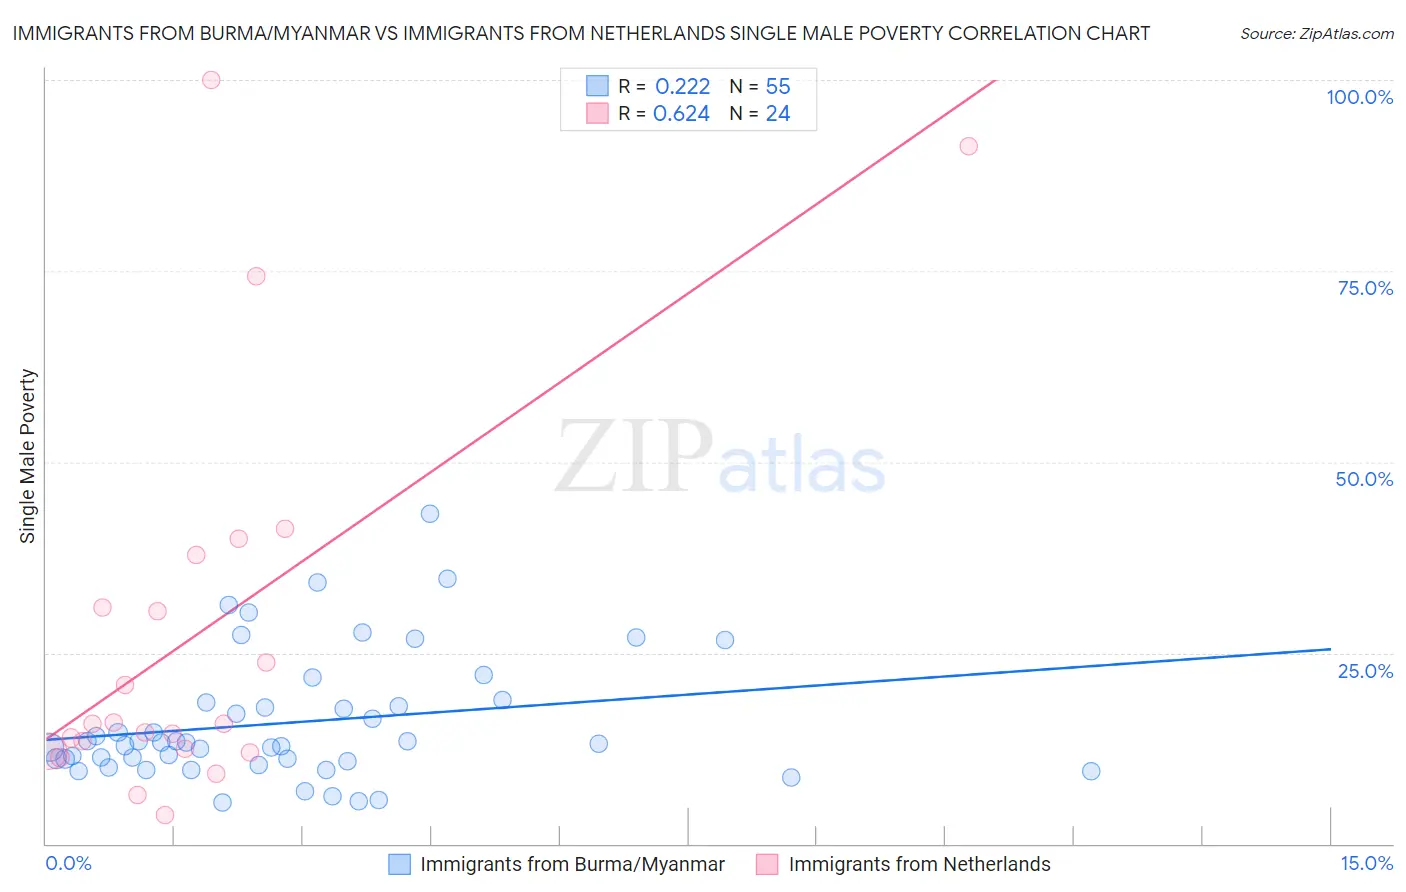
Immigrants from Burma/Myanmar vs Immigrants from Netherlands Single Male Poverty Correlation Chart
The statistical analysis conducted on geographies consisting of 162,611,210 people shows a weak positive correlation between the proportion of Immigrants from Burma/Myanmar and poverty level among single males in the United States with a correlation coefficient (R) of 0.222 and weighted average of 13.1%. Similarly, the statistical analysis conducted on geographies consisting of 216,285,170 people shows a significant positive correlation between the proportion of Immigrants from Netherlands and poverty level among single males in the United States with a correlation coefficient (R) of 0.624 and weighted average of 12.5%, a difference of 5.1%.
Single Male Poverty Correlation Summary
| Measurement | Immigrants from Burma/Myanmar | Immigrants from Netherlands |
| Minimum | 5.4% | 3.8% |
| Maximum | 43.1% | 100.0% |
| Range | 37.7% | 96.2% |
| Mean | 15.9% | 27.6% |
| Median | 13.3% | 15.7% |
| Interquartile 25% (IQ1) | 10.8% | 12.3% |
| Interquartile 75% (IQ3) | 18.5% | 34.4% |
| Interquartile Range (IQR) | 7.8% | 22.1% |
| Standard Deviation (Sample) | 8.3% | 26.0% |
| Standard Deviation (Population) | 8.2% | 25.4% |
Similar Demographics by Single Male Poverty
Demographics Similar to Immigrants from Burma/Myanmar by Single Male Poverty
In terms of single male poverty, the demographic groups most similar to Immigrants from Burma/Myanmar are Scandinavian (13.1%, a difference of 0.030%), Bermudan (13.1%, a difference of 0.050%), Austrian (13.1%, a difference of 0.15%), Central American (13.2%, a difference of 0.22%), and Japanese (13.1%, a difference of 0.24%).
| Demographics | Rating | Rank | Single Male Poverty |
| Senegalese | 16.4 /100 | #212 | Poor 13.1% |
| Italians | 15.9 /100 | #213 | Poor 13.1% |
| Zimbabweans | 14.9 /100 | #214 | Poor 13.1% |
| Japanese | 14.8 /100 | #215 | Poor 13.1% |
| Austrians | 13.9 /100 | #216 | Poor 13.1% |
| Bermudans | 13.0 /100 | #217 | Poor 13.1% |
| Scandinavians | 12.9 /100 | #218 | Poor 13.1% |
| Immigrants | Burma/Myanmar | 12.6 /100 | #219 | Poor 13.1% |
| Central Americans | 10.9 /100 | #220 | Poor 13.2% |
| New Zealanders | 10.7 /100 | #221 | Poor 13.2% |
| Immigrants | Western Europe | 10.0 /100 | #222 | Poor 13.2% |
| Immigrants | Azores | 9.3 /100 | #223 | Tragic 13.2% |
| Somalis | 9.1 /100 | #224 | Tragic 13.2% |
| Immigrants | Denmark | 8.7 /100 | #225 | Tragic 13.2% |
| Jamaicans | 7.7 /100 | #226 | Tragic 13.2% |
Demographics Similar to Immigrants from Netherlands by Single Male Poverty
In terms of single male poverty, the demographic groups most similar to Immigrants from Netherlands are Romanian (12.5%, a difference of 0.010%), Ecuadorian (12.5%, a difference of 0.040%), Immigrants from Sierra Leone (12.5%, a difference of 0.080%), Immigrants from Jordan (12.5%, a difference of 0.10%), and Russian (12.5%, a difference of 0.13%).
| Demographics | Rating | Rank | Single Male Poverty |
| Venezuelans | 89.4 /100 | #120 | Excellent 12.4% |
| Icelanders | 88.2 /100 | #121 | Excellent 12.5% |
| Serbians | 87.9 /100 | #122 | Excellent 12.5% |
| Immigrants | Kenya | 87.6 /100 | #123 | Excellent 12.5% |
| Russians | 87.3 /100 | #124 | Excellent 12.5% |
| Immigrants | Jordan | 87.1 /100 | #125 | Excellent 12.5% |
| Romanians | 86.4 /100 | #126 | Excellent 12.5% |
| Immigrants | Netherlands | 86.2 /100 | #127 | Excellent 12.5% |
| Ecuadorians | 85.9 /100 | #128 | Excellent 12.5% |
| Immigrants | Sierra Leone | 85.5 /100 | #129 | Excellent 12.5% |
| Immigrants | Nicaragua | 84.8 /100 | #130 | Excellent 12.5% |
| Immigrants | Northern Europe | 83.7 /100 | #131 | Excellent 12.5% |
| Salvadorans | 83.7 /100 | #132 | Excellent 12.5% |
| Immigrants | Western Asia | 83.4 /100 | #133 | Excellent 12.5% |
| Immigrants | Ecuador | 82.1 /100 | #134 | Excellent 12.5% |