Immigrants from Burma/Myanmar vs Immigrants from Jordan Median Female Earnings
COMPARE
Immigrants from Burma/Myanmar
Immigrants from Jordan
Median Female Earnings
Median Female Earnings Comparison
Immigrants from Burma/Myanmar
Immigrants from Jordan
$38,028
MEDIAN FEMALE EARNINGS
3.0/ 100
METRIC RATING
242nd/ 347
METRIC RANK
$40,977
MEDIAN FEMALE EARNINGS
93.5/ 100
METRIC RATING
122nd/ 347
METRIC RANK
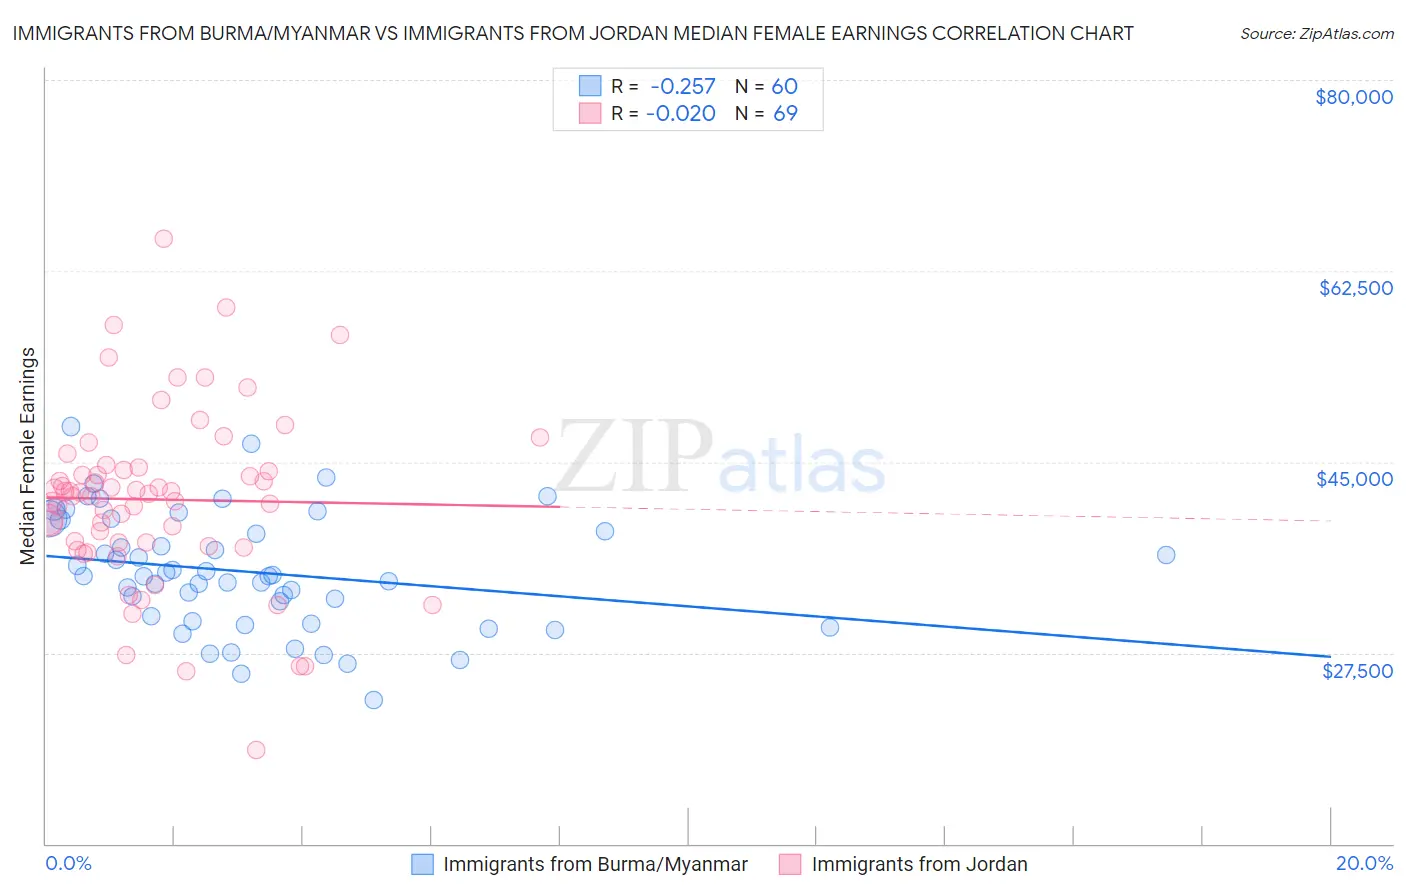
Immigrants from Burma/Myanmar vs Immigrants from Jordan Median Female Earnings Correlation Chart
The statistical analysis conducted on geographies consisting of 172,347,432 people shows a weak negative correlation between the proportion of Immigrants from Burma/Myanmar and median female earnings in the United States with a correlation coefficient (R) of -0.257 and weighted average of $38,028. Similarly, the statistical analysis conducted on geographies consisting of 181,274,544 people shows no correlation between the proportion of Immigrants from Jordan and median female earnings in the United States with a correlation coefficient (R) of -0.020 and weighted average of $40,977, a difference of 7.8%.
Median Female Earnings Correlation Summary
| Measurement | Immigrants from Burma/Myanmar | Immigrants from Jordan |
| Minimum | $23,125 | $18,558 |
| Maximum | $48,239 | $65,466 |
| Range | $25,114 | $46,908 |
| Mean | $34,892 | $41,547 |
| Median | $34,545 | $42,113 |
| Interquartile 25% (IQ1) | $30,606 | $37,412 |
| Interquartile 75% (IQ3) | $39,132 | $44,413 |
| Interquartile Range (IQR) | $8,525 | $7,001 |
| Standard Deviation (Sample) | $5,366 | $8,068 |
| Standard Deviation (Population) | $5,321 | $8,010 |
Similar Demographics by Median Female Earnings
Demographics Similar to Immigrants from Burma/Myanmar by Median Female Earnings
In terms of median female earnings, the demographic groups most similar to Immigrants from Burma/Myanmar are German ($37,986, a difference of 0.11%), Immigrants from Liberia ($37,970, a difference of 0.15%), Immigrants from Middle Africa ($37,965, a difference of 0.17%), Delaware ($37,964, a difference of 0.17%), and Spanish ($38,098, a difference of 0.18%).
| Demographics | Rating | Rank | Median Female Earnings |
| Sudanese | 4.4 /100 | #235 | Tragic $38,215 |
| Liberians | 4.4 /100 | #236 | Tragic $38,215 |
| Immigrants | Cabo Verde | 4.3 /100 | #237 | Tragic $38,208 |
| Alaska Natives | 4.3 /100 | #238 | Tragic $38,202 |
| English | 4.2 /100 | #239 | Tragic $38,196 |
| Finns | 4.0 /100 | #240 | Tragic $38,173 |
| Spanish | 3.5 /100 | #241 | Tragic $38,098 |
| Immigrants | Burma/Myanmar | 3.0 /100 | #242 | Tragic $38,028 |
| Germans | 2.8 /100 | #243 | Tragic $37,986 |
| Immigrants | Liberia | 2.7 /100 | #244 | Tragic $37,970 |
| Immigrants | Middle Africa | 2.7 /100 | #245 | Tragic $37,965 |
| Delaware | 2.6 /100 | #246 | Tragic $37,964 |
| Immigrants | Somalia | 2.4 /100 | #247 | Tragic $37,914 |
| Alaskan Athabascans | 2.3 /100 | #248 | Tragic $37,905 |
| Swiss | 2.3 /100 | #249 | Tragic $37,904 |
Demographics Similar to Immigrants from Jordan by Median Female Earnings
In terms of median female earnings, the demographic groups most similar to Immigrants from Jordan are Guyanese ($40,973, a difference of 0.010%), Croatian ($40,993, a difference of 0.040%), Trinidadian and Tobagonian ($40,958, a difference of 0.050%), Austrian ($40,923, a difference of 0.13%), and Immigrants from Kuwait ($41,055, a difference of 0.19%).
| Demographics | Rating | Rank | Median Female Earnings |
| Koreans | 96.4 /100 | #115 | Exceptional $41,276 |
| Immigrants | Brazil | 96.4 /100 | #116 | Exceptional $41,273 |
| Barbadians | 96.3 /100 | #117 | Exceptional $41,261 |
| Immigrants | Lebanon | 95.6 /100 | #118 | Exceptional $41,183 |
| Immigrants | Philippines | 95.0 /100 | #119 | Exceptional $41,114 |
| Immigrants | Kuwait | 94.4 /100 | #120 | Exceptional $41,055 |
| Croatians | 93.7 /100 | #121 | Exceptional $40,993 |
| Immigrants | Jordan | 93.5 /100 | #122 | Exceptional $40,977 |
| Guyanese | 93.4 /100 | #123 | Exceptional $40,973 |
| Trinidadians and Tobagonians | 93.2 /100 | #124 | Exceptional $40,958 |
| Austrians | 92.7 /100 | #125 | Exceptional $40,923 |
| Immigrants | Trinidad and Tobago | 92.3 /100 | #126 | Exceptional $40,895 |
| Ugandans | 92.2 /100 | #127 | Exceptional $40,889 |
| Carpatho Rusyns | 91.2 /100 | #128 | Exceptional $40,825 |
| Zimbabweans | 90.8 /100 | #129 | Exceptional $40,798 |