Immigrants from Africa vs Argentinean Male Unemployment
COMPARE
Immigrants from Africa
Argentinean
Male Unemployment
Male Unemployment Comparison
Immigrants from Africa
Argentineans
5.6%
MALE UNEMPLOYMENT
1.7/ 100
METRIC RATING
230th/ 347
METRIC RANK
5.0%
MALE UNEMPLOYMENT
96.2/ 100
METRIC RATING
80th/ 347
METRIC RANK
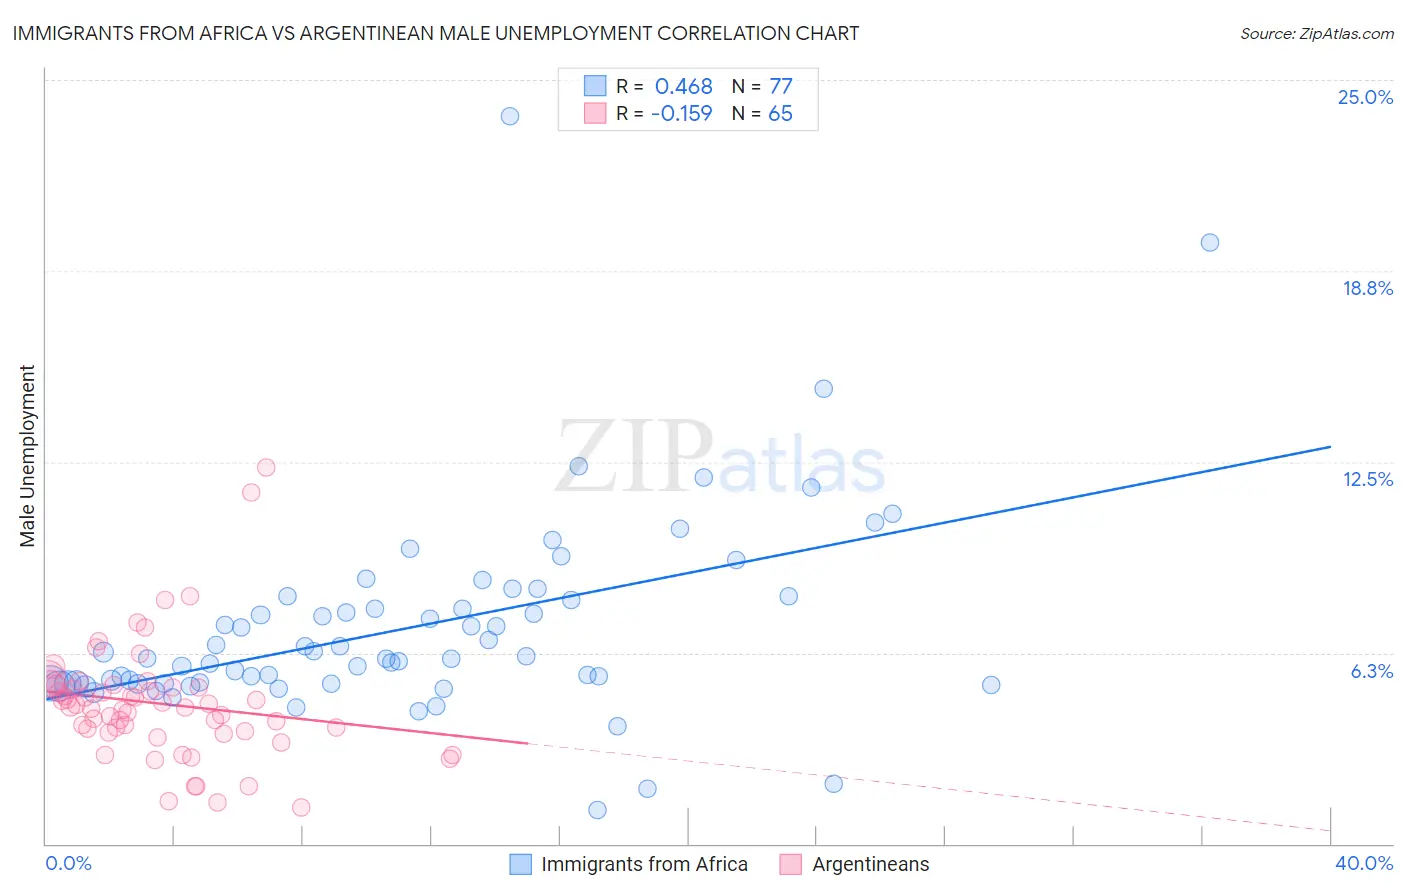
Immigrants from Africa vs Argentinean Male Unemployment Correlation Chart
The statistical analysis conducted on geographies consisting of 466,728,054 people shows a moderate positive correlation between the proportion of Immigrants from Africa and unemployment rate among males in the United States with a correlation coefficient (R) of 0.468 and weighted average of 5.6%. Similarly, the statistical analysis conducted on geographies consisting of 296,564,256 people shows a poor negative correlation between the proportion of Argentineans and unemployment rate among males in the United States with a correlation coefficient (R) of -0.159 and weighted average of 5.0%, a difference of 11.2%.
Male Unemployment Correlation Summary
| Measurement | Immigrants from Africa | Argentinean |
| Minimum | 1.1% | 1.2% |
| Maximum | 23.8% | 12.3% |
| Range | 22.7% | 11.1% |
| Mean | 7.1% | 4.6% |
| Median | 6.1% | 4.5% |
| Interquartile 25% (IQ1) | 5.2% | 3.7% |
| Interquartile 75% (IQ3) | 8.0% | 5.2% |
| Interquartile Range (IQR) | 2.8% | 1.5% |
| Standard Deviation (Sample) | 3.4% | 1.9% |
| Standard Deviation (Population) | 3.3% | 1.9% |
Similar Demographics by Male Unemployment
Demographics Similar to Immigrants from Africa by Male Unemployment
In terms of male unemployment, the demographic groups most similar to Immigrants from Africa are Seminole (5.6%, a difference of 0.040%), Central American (5.6%, a difference of 0.040%), Choctaw (5.6%, a difference of 0.050%), Immigrants from Cambodia (5.6%, a difference of 0.060%), and Immigrants from Panama (5.6%, a difference of 0.060%).
| Demographics | Rating | Rank | Male Unemployment |
| Creek | 2.6 /100 | #223 | Tragic 5.6% |
| Cherokee | 2.4 /100 | #224 | Tragic 5.6% |
| Panamanians | 1.9 /100 | #225 | Tragic 5.6% |
| Immigrants | Cambodia | 1.8 /100 | #226 | Tragic 5.6% |
| Immigrants | Panama | 1.8 /100 | #227 | Tragic 5.6% |
| Seminole | 1.8 /100 | #228 | Tragic 5.6% |
| Central Americans | 1.8 /100 | #229 | Tragic 5.6% |
| Immigrants | Africa | 1.7 /100 | #230 | Tragic 5.6% |
| Choctaw | 1.6 /100 | #231 | Tragic 5.6% |
| Moroccans | 1.6 /100 | #232 | Tragic 5.6% |
| Somalis | 1.5 /100 | #233 | Tragic 5.6% |
| Immigrants | Somalia | 1.5 /100 | #234 | Tragic 5.6% |
| Immigrants | Honduras | 1.5 /100 | #235 | Tragic 5.6% |
| Guatemalans | 1.2 /100 | #236 | Tragic 5.6% |
| Hondurans | 1.1 /100 | #237 | Tragic 5.6% |
Demographics Similar to Argentineans by Male Unemployment
In terms of male unemployment, the demographic groups most similar to Argentineans are French (5.0%, a difference of 0.0%), Chilean (5.0%, a difference of 0.040%), South African (5.0%, a difference of 0.050%), Immigrants from Northern Europe (5.0%, a difference of 0.060%), and Iranian (5.0%, a difference of 0.080%).
| Demographics | Rating | Rank | Male Unemployment |
| Greeks | 97.0 /100 | #73 | Exceptional 5.0% |
| Immigrants | North America | 96.9 /100 | #74 | Exceptional 5.0% |
| Assyrians/Chaldeans/Syriacs | 96.9 /100 | #75 | Exceptional 5.0% |
| Immigrants | Sudan | 96.5 /100 | #76 | Exceptional 5.0% |
| Iranians | 96.4 /100 | #77 | Exceptional 5.0% |
| Immigrants | Northern Europe | 96.4 /100 | #78 | Exceptional 5.0% |
| South Africans | 96.4 /100 | #79 | Exceptional 5.0% |
| Argentineans | 96.2 /100 | #80 | Exceptional 5.0% |
| French | 96.2 /100 | #81 | Exceptional 5.0% |
| Chileans | 96.2 /100 | #82 | Exceptional 5.0% |
| Immigrants | Eritrea | 96.0 /100 | #83 | Exceptional 5.0% |
| Serbians | 95.7 /100 | #84 | Exceptional 5.1% |
| Immigrants | North Macedonia | 95.6 /100 | #85 | Exceptional 5.1% |
| Maltese | 95.5 /100 | #86 | Exceptional 5.1% |
| Immigrants | Romania | 95.4 /100 | #87 | Exceptional 5.1% |