Immigrants from Venezuela vs Nonimmigrants Householder Income Over 65 years
COMPARE
Immigrants from Venezuela
Nonimmigrants
Householder Income Over 65 years
Householder Income Over 65 years Comparison
Immigrants from Venezuela
Nonimmigrants
$57,371
HOUSEHOLDER INCOME OVER 65 YEARS
2.3/ 100
METRIC RATING
232nd/ 347
METRIC RANK
$57,426
HOUSEHOLDER INCOME OVER 65 YEARS
2.4/ 100
METRIC RATING
231st/ 347
METRIC RANK
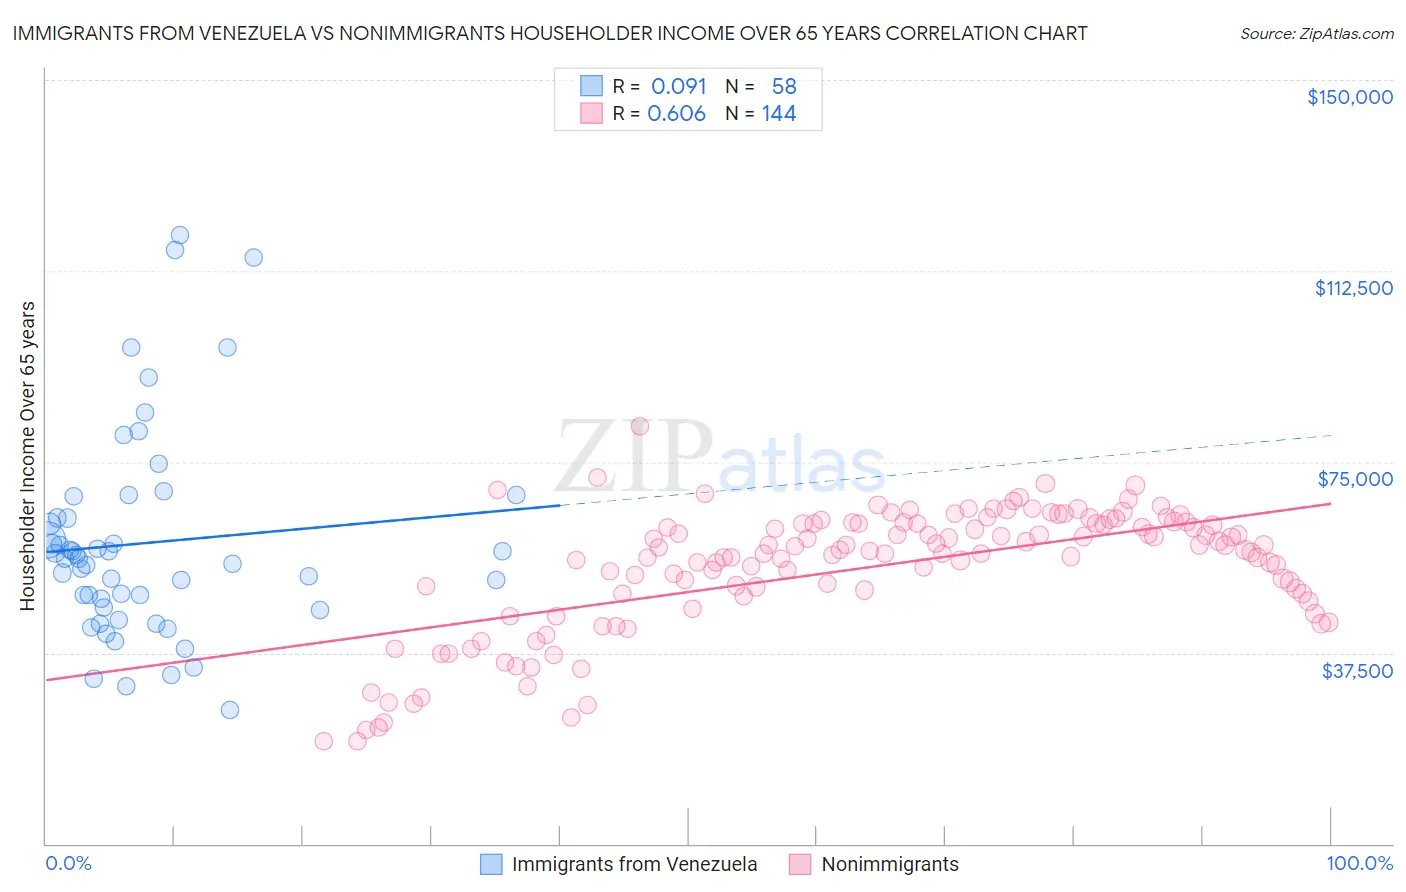
Immigrants from Venezuela vs Nonimmigrants Householder Income Over 65 years Correlation Chart
The statistical analysis conducted on geographies consisting of 287,361,159 people shows a slight positive correlation between the proportion of Immigrants from Venezuela and household income with householder over the age of 65 in the United States with a correlation coefficient (R) of 0.091 and weighted average of $57,371. Similarly, the statistical analysis conducted on geographies consisting of 577,532,180 people shows a significant positive correlation between the proportion of Nonimmigrants and household income with householder over the age of 65 in the United States with a correlation coefficient (R) of 0.606 and weighted average of $57,426, a difference of 0.090%.
Householder Income Over 65 years Correlation Summary
| Measurement | Immigrants from Venezuela | Nonimmigrants |
| Minimum | $26,376 | $20,075 |
| Maximum | $119,643 | $81,974 |
| Range | $93,267 | $61,899 |
| Mean | $59,079 | $54,158 |
| Median | $55,975 | $57,563 |
| Interquartile 25% (IQ1) | $46,366 | $49,141 |
| Interquartile 75% (IQ3) | $63,983 | $62,877 |
| Interquartile Range (IQR) | $17,617 | $13,736 |
| Standard Deviation (Sample) | $20,462 | $12,340 |
| Standard Deviation (Population) | $20,285 | $12,297 |
Demographics Similar to Immigrants from Venezuela and Nonimmigrants by Householder Income Over 65 years
In terms of householder income over 65 years, the demographic groups most similar to Immigrants from Venezuela are Immigrants from Cambodia ($57,580, a difference of 0.36%), Immigrants from Western Africa ($57,119, a difference of 0.44%), Immigrants from Burma/Myanmar ($57,114, a difference of 0.45%), Immigrants from Colombia ($57,658, a difference of 0.50%), and Spanish American ($57,021, a difference of 0.61%). Similarly, the demographic groups most similar to Nonimmigrants are Immigrants from Cambodia ($57,580, a difference of 0.27%), Immigrants from Colombia ($57,658, a difference of 0.41%), Immigrants from Western Africa ($57,119, a difference of 0.54%), Immigrants from Burma/Myanmar ($57,114, a difference of 0.55%), and Immigrants from Albania ($57,828, a difference of 0.70%).
| Demographics | Rating | Rank | Householder Income Over 65 years |
| Immigrants | El Salvador | 5.4 /100 | #221 | Tragic $58,226 |
| Delaware | 5.3 /100 | #222 | Tragic $58,214 |
| Tsimshian | 5.2 /100 | #223 | Tragic $58,202 |
| Bermudans | 5.1 /100 | #224 | Tragic $58,171 |
| Venezuelans | 4.4 /100 | #225 | Tragic $58,026 |
| French Canadians | 4.2 /100 | #226 | Tragic $57,975 |
| Japanese | 3.9 /100 | #227 | Tragic $57,919 |
| Immigrants | Albania | 3.6 /100 | #228 | Tragic $57,828 |
| Immigrants | Colombia | 3.0 /100 | #229 | Tragic $57,658 |
| Immigrants | Cambodia | 2.8 /100 | #230 | Tragic $57,580 |
| Immigrants | Nonimmigrants | 2.4 /100 | #231 | Tragic $57,426 |
| Immigrants | Venezuela | 2.3 /100 | #232 | Tragic $57,371 |
| Immigrants | Western Africa | 1.7 /100 | #233 | Tragic $57,119 |
| Immigrants | Burma/Myanmar | 1.7 /100 | #234 | Tragic $57,114 |
| Spanish Americans | 1.6 /100 | #235 | Tragic $57,021 |
| Immigrants | Uruguay | 1.5 /100 | #236 | Tragic $56,975 |
| Immigrants | Panama | 1.5 /100 | #237 | Tragic $56,944 |
| Fijians | 1.2 /100 | #238 | Tragic $56,768 |
| Immigrants | Laos | 1.2 /100 | #239 | Tragic $56,722 |
| Sub-Saharan Africans | 1.0 /100 | #240 | Tragic $56,615 |
| Immigrants | Guyana | 0.9 /100 | #241 | Tragic $56,495 |