Korean vs Nonimmigrants Householder Income Over 65 years
COMPARE
Korean
Nonimmigrants
Householder Income Over 65 years
Householder Income Over 65 years Comparison
Koreans
Nonimmigrants
$67,472
HOUSEHOLDER INCOME OVER 65 YEARS
99.9/ 100
METRIC RATING
41st/ 347
METRIC RANK
$57,426
HOUSEHOLDER INCOME OVER 65 YEARS
2.4/ 100
METRIC RATING
231st/ 347
METRIC RANK
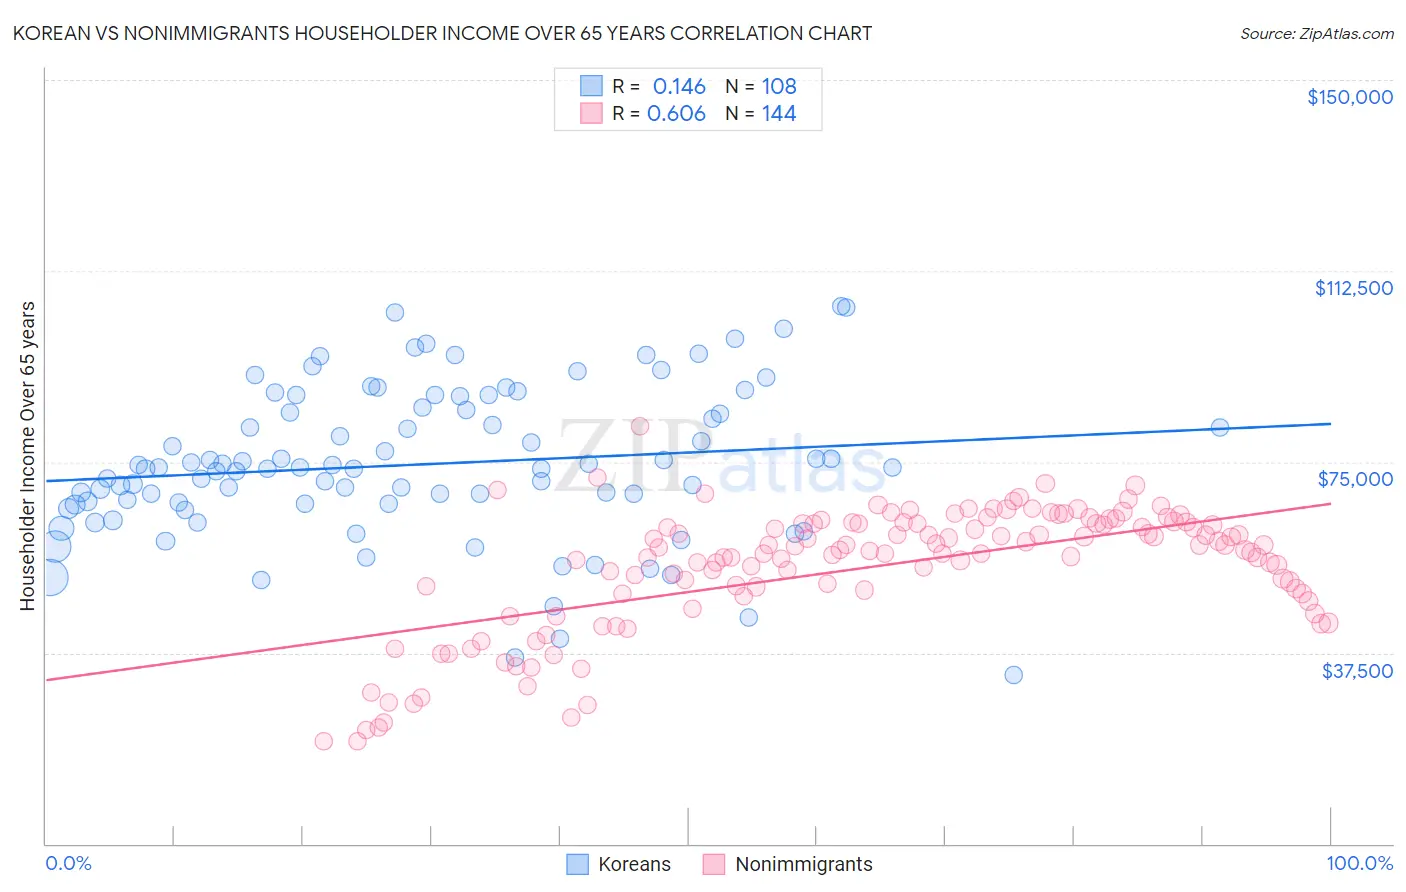
Korean vs Nonimmigrants Householder Income Over 65 years Correlation Chart
The statistical analysis conducted on geographies consisting of 507,905,731 people shows a poor positive correlation between the proportion of Koreans and household income with householder over the age of 65 in the United States with a correlation coefficient (R) of 0.146 and weighted average of $67,472. Similarly, the statistical analysis conducted on geographies consisting of 577,532,180 people shows a significant positive correlation between the proportion of Nonimmigrants and household income with householder over the age of 65 in the United States with a correlation coefficient (R) of 0.606 and weighted average of $57,426, a difference of 17.5%.
Householder Income Over 65 years Correlation Summary
| Measurement | Korean | Nonimmigrants |
| Minimum | $33,125 | $20,075 |
| Maximum | $105,510 | $81,974 |
| Range | $72,385 | $61,899 |
| Mean | $74,525 | $54,158 |
| Median | $73,782 | $57,563 |
| Interquartile 25% (IQ1) | $66,806 | $49,141 |
| Interquartile 75% (IQ3) | $85,369 | $62,877 |
| Interquartile Range (IQR) | $18,562 | $13,736 |
| Standard Deviation (Sample) | $14,819 | $12,340 |
| Standard Deviation (Population) | $14,750 | $12,297 |
Similar Demographics by Householder Income Over 65 years
Demographics Similar to Koreans by Householder Income Over 65 years
In terms of householder income over 65 years, the demographic groups most similar to Koreans are Immigrants from Asia ($67,594, a difference of 0.18%), New Zealander ($67,333, a difference of 0.21%), Latvian ($67,326, a difference of 0.22%), Russian ($67,626, a difference of 0.23%), and Immigrants from South Africa ($67,234, a difference of 0.35%).
| Demographics | Rating | Rank | Householder Income Over 65 years |
| Immigrants | Ireland | 100.0 /100 | #34 | Exceptional $68,495 |
| Tongans | 100.0 /100 | #35 | Exceptional $68,235 |
| Immigrants | Austria | 99.9 /100 | #36 | Exceptional $68,208 |
| Turks | 99.9 /100 | #37 | Exceptional $68,037 |
| Estonians | 99.9 /100 | #38 | Exceptional $67,926 |
| Russians | 99.9 /100 | #39 | Exceptional $67,626 |
| Immigrants | Asia | 99.9 /100 | #40 | Exceptional $67,594 |
| Koreans | 99.9 /100 | #41 | Exceptional $67,472 |
| New Zealanders | 99.9 /100 | #42 | Exceptional $67,333 |
| Latvians | 99.9 /100 | #43 | Exceptional $67,326 |
| Immigrants | South Africa | 99.9 /100 | #44 | Exceptional $67,234 |
| Immigrants | Afghanistan | 99.8 /100 | #45 | Exceptional $67,007 |
| Cambodians | 99.8 /100 | #46 | Exceptional $66,892 |
| Australians | 99.8 /100 | #47 | Exceptional $66,891 |
| Immigrants | France | 99.8 /100 | #48 | Exceptional $66,826 |
Demographics Similar to Nonimmigrants by Householder Income Over 65 years
In terms of householder income over 65 years, the demographic groups most similar to Nonimmigrants are Immigrants from Venezuela ($57,371, a difference of 0.090%), Immigrants from Cambodia ($57,580, a difference of 0.27%), Immigrants from Colombia ($57,658, a difference of 0.41%), Immigrants from Western Africa ($57,119, a difference of 0.54%), and Immigrants from Burma/Myanmar ($57,114, a difference of 0.55%).
| Demographics | Rating | Rank | Householder Income Over 65 years |
| Bermudans | 5.1 /100 | #224 | Tragic $58,171 |
| Venezuelans | 4.4 /100 | #225 | Tragic $58,026 |
| French Canadians | 4.2 /100 | #226 | Tragic $57,975 |
| Japanese | 3.9 /100 | #227 | Tragic $57,919 |
| Immigrants | Albania | 3.6 /100 | #228 | Tragic $57,828 |
| Immigrants | Colombia | 3.0 /100 | #229 | Tragic $57,658 |
| Immigrants | Cambodia | 2.8 /100 | #230 | Tragic $57,580 |
| Immigrants | Nonimmigrants | 2.4 /100 | #231 | Tragic $57,426 |
| Immigrants | Venezuela | 2.3 /100 | #232 | Tragic $57,371 |
| Immigrants | Western Africa | 1.7 /100 | #233 | Tragic $57,119 |
| Immigrants | Burma/Myanmar | 1.7 /100 | #234 | Tragic $57,114 |
| Spanish Americans | 1.6 /100 | #235 | Tragic $57,021 |
| Immigrants | Uruguay | 1.5 /100 | #236 | Tragic $56,975 |
| Immigrants | Panama | 1.5 /100 | #237 | Tragic $56,944 |
| Fijians | 1.2 /100 | #238 | Tragic $56,768 |