Puerto Rican vs Immigrants from South Africa Householder Income Over 65 years
COMPARE
Puerto Rican
Immigrants from South Africa
Householder Income Over 65 years
Householder Income Over 65 years Comparison
Puerto Ricans
Immigrants from South Africa
$42,550
HOUSEHOLDER INCOME OVER 65 YEARS
0.0/ 100
METRIC RATING
346th/ 347
METRIC RANK
$67,234
HOUSEHOLDER INCOME OVER 65 YEARS
99.9/ 100
METRIC RATING
44th/ 347
METRIC RANK
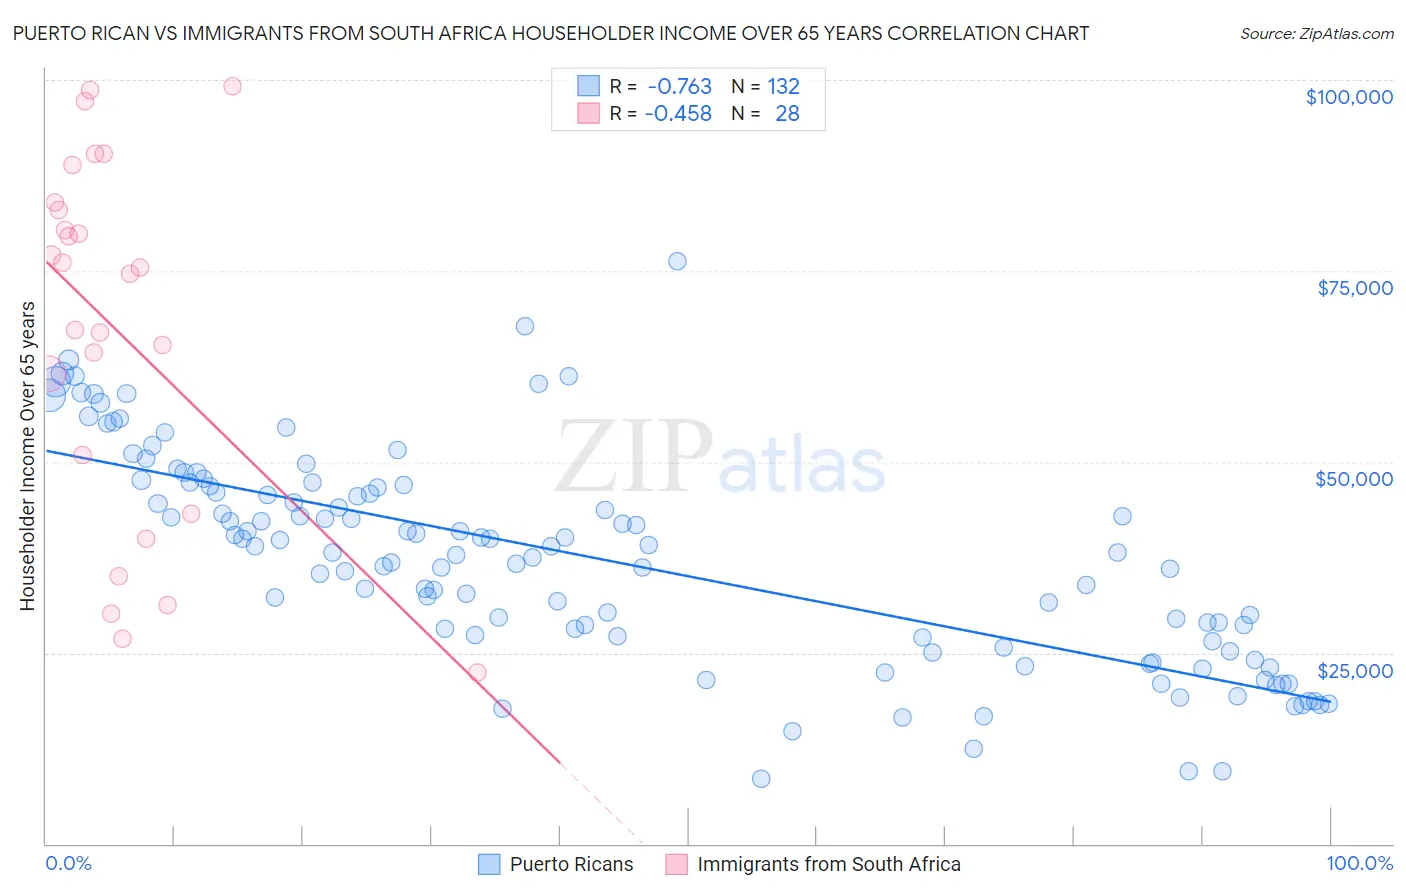
Puerto Rican vs Immigrants from South Africa Householder Income Over 65 years Correlation Chart
The statistical analysis conducted on geographies consisting of 524,809,203 people shows a strong negative correlation between the proportion of Puerto Ricans and household income with householder over the age of 65 in the United States with a correlation coefficient (R) of -0.763 and weighted average of $42,550. Similarly, the statistical analysis conducted on geographies consisting of 232,954,007 people shows a moderate negative correlation between the proportion of Immigrants from South Africa and household income with householder over the age of 65 in the United States with a correlation coefficient (R) of -0.458 and weighted average of $67,234, a difference of 58.0%.
Householder Income Over 65 years Correlation Summary
| Measurement | Puerto Rican | Immigrants from South Africa |
| Minimum | $8,529 | $22,500 |
| Maximum | $76,277 | $99,125 |
| Range | $67,748 | $76,625 |
| Mean | $37,319 | $67,143 |
| Median | $38,145 | $74,972 |
| Interquartile 25% (IQ1) | $26,777 | $47,057 |
| Interquartile 75% (IQ3) | $46,716 | $83,529 |
| Interquartile Range (IQR) | $19,939 | $36,471 |
| Standard Deviation (Sample) | $13,872 | $23,355 |
| Standard Deviation (Population) | $13,820 | $22,935 |
Similar Demographics by Householder Income Over 65 years
Demographics Similar to Puerto Ricans by Householder Income Over 65 years
In terms of householder income over 65 years, the demographic groups most similar to Puerto Ricans are Lumbee ($40,550, a difference of 4.9%), Immigrants from Cuba ($44,735, a difference of 5.1%), Houma ($44,822, a difference of 5.3%), Immigrants from Dominican Republic ($45,758, a difference of 7.5%), and Immigrants from Cabo Verde ($46,654, a difference of 9.7%).
| Demographics | Rating | Rank | Householder Income Over 65 years |
| Cape Verdeans | 0.0 /100 | #333 | Tragic $50,077 |
| Immigrants | Dominica | 0.0 /100 | #334 | Tragic $50,071 |
| Crow | 0.0 /100 | #335 | Tragic $49,234 |
| Cubans | 0.0 /100 | #336 | Tragic $49,152 |
| Tohono O'odham | 0.0 /100 | #337 | Tragic $49,121 |
| Immigrants | Caribbean | 0.0 /100 | #338 | Tragic $48,535 |
| Navajo | 0.0 /100 | #339 | Tragic $47,722 |
| Immigrants | Yemen | 0.0 /100 | #340 | Tragic $47,527 |
| Dominicans | 0.0 /100 | #341 | Tragic $46,964 |
| Immigrants | Cabo Verde | 0.0 /100 | #342 | Tragic $46,654 |
| Immigrants | Dominican Republic | 0.0 /100 | #343 | Tragic $45,758 |
| Houma | 0.0 /100 | #344 | Tragic $44,822 |
| Immigrants | Cuba | 0.0 /100 | #345 | Tragic $44,735 |
| Puerto Ricans | 0.0 /100 | #346 | Tragic $42,550 |
| Lumbee | 0.0 /100 | #347 | Tragic $40,550 |
Demographics Similar to Immigrants from South Africa by Householder Income Over 65 years
In terms of householder income over 65 years, the demographic groups most similar to Immigrants from South Africa are Latvian ($67,326, a difference of 0.14%), New Zealander ($67,333, a difference of 0.15%), Immigrants from Afghanistan ($67,007, a difference of 0.34%), Korean ($67,472, a difference of 0.35%), and Cambodian ($66,892, a difference of 0.51%).
| Demographics | Rating | Rank | Householder Income Over 65 years |
| Turks | 99.9 /100 | #37 | Exceptional $68,037 |
| Estonians | 99.9 /100 | #38 | Exceptional $67,926 |
| Russians | 99.9 /100 | #39 | Exceptional $67,626 |
| Immigrants | Asia | 99.9 /100 | #40 | Exceptional $67,594 |
| Koreans | 99.9 /100 | #41 | Exceptional $67,472 |
| New Zealanders | 99.9 /100 | #42 | Exceptional $67,333 |
| Latvians | 99.9 /100 | #43 | Exceptional $67,326 |
| Immigrants | South Africa | 99.9 /100 | #44 | Exceptional $67,234 |
| Immigrants | Afghanistan | 99.8 /100 | #45 | Exceptional $67,007 |
| Cambodians | 99.8 /100 | #46 | Exceptional $66,892 |
| Australians | 99.8 /100 | #47 | Exceptional $66,891 |
| Immigrants | France | 99.8 /100 | #48 | Exceptional $66,826 |
| Immigrants | Indonesia | 99.8 /100 | #49 | Exceptional $66,694 |
| Immigrants | Turkey | 99.7 /100 | #50 | Exceptional $66,672 |
| Israelis | 99.7 /100 | #51 | Exceptional $66,636 |