Immigrants from Czechoslovakia vs Immigrants from South Africa Householder Income Over 65 years
COMPARE
Immigrants from Czechoslovakia
Immigrants from South Africa
Householder Income Over 65 years
Householder Income Over 65 years Comparison
Immigrants from Czechoslovakia
Immigrants from South Africa
$66,376
HOUSEHOLDER INCOME OVER 65 YEARS
99.7/ 100
METRIC RATING
55th/ 347
METRIC RANK
$67,234
HOUSEHOLDER INCOME OVER 65 YEARS
99.9/ 100
METRIC RATING
44th/ 347
METRIC RANK
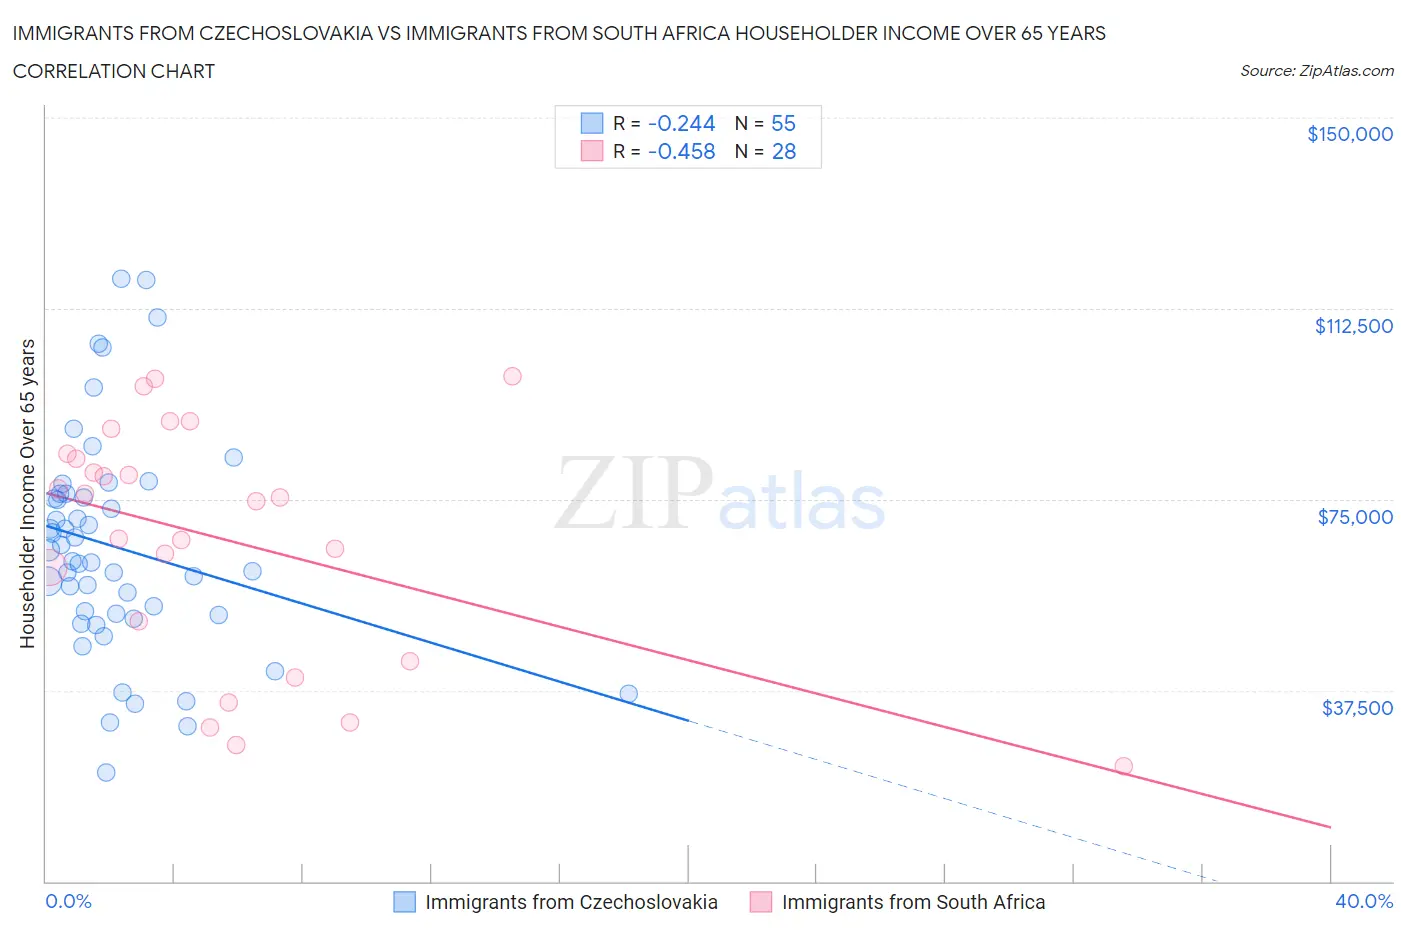
Immigrants from Czechoslovakia vs Immigrants from South Africa Householder Income Over 65 years Correlation Chart
The statistical analysis conducted on geographies consisting of 195,347,436 people shows a weak negative correlation between the proportion of Immigrants from Czechoslovakia and household income with householder over the age of 65 in the United States with a correlation coefficient (R) of -0.244 and weighted average of $66,376. Similarly, the statistical analysis conducted on geographies consisting of 232,954,007 people shows a moderate negative correlation between the proportion of Immigrants from South Africa and household income with householder over the age of 65 in the United States with a correlation coefficient (R) of -0.458 and weighted average of $67,234, a difference of 1.3%.
Householder Income Over 65 years Correlation Summary
| Measurement | Immigrants from Czechoslovakia | Immigrants from South Africa |
| Minimum | $21,250 | $22,500 |
| Maximum | $118,263 | $99,125 |
| Range | $97,013 | $76,625 |
| Mean | $65,530 | $67,143 |
| Median | $62,798 | $74,972 |
| Interquartile 25% (IQ1) | $52,303 | $47,057 |
| Interquartile 75% (IQ3) | $76,120 | $83,529 |
| Interquartile Range (IQR) | $23,817 | $36,471 |
| Standard Deviation (Sample) | $21,477 | $23,355 |
| Standard Deviation (Population) | $21,281 | $22,935 |
Demographics Similar to Immigrants from Czechoslovakia and Immigrants from South Africa by Householder Income Over 65 years
In terms of householder income over 65 years, the demographic groups most similar to Immigrants from Czechoslovakia are Laotian ($66,306, a difference of 0.11%), Immigrants from Netherlands ($66,463, a difference of 0.13%), Bulgarian ($66,236, a difference of 0.21%), Immigrants from Philippines ($66,161, a difference of 0.33%), and Immigrants from Pakistan ($66,617, a difference of 0.36%). Similarly, the demographic groups most similar to Immigrants from South Africa are Latvian ($67,326, a difference of 0.14%), New Zealander ($67,333, a difference of 0.15%), Immigrants from Afghanistan ($67,007, a difference of 0.34%), Korean ($67,472, a difference of 0.35%), and Cambodian ($66,892, a difference of 0.51%).
| Demographics | Rating | Rank | Householder Income Over 65 years |
| Russians | 99.9 /100 | #39 | Exceptional $67,626 |
| Immigrants | Asia | 99.9 /100 | #40 | Exceptional $67,594 |
| Koreans | 99.9 /100 | #41 | Exceptional $67,472 |
| New Zealanders | 99.9 /100 | #42 | Exceptional $67,333 |
| Latvians | 99.9 /100 | #43 | Exceptional $67,326 |
| Immigrants | South Africa | 99.9 /100 | #44 | Exceptional $67,234 |
| Immigrants | Afghanistan | 99.8 /100 | #45 | Exceptional $67,007 |
| Cambodians | 99.8 /100 | #46 | Exceptional $66,892 |
| Australians | 99.8 /100 | #47 | Exceptional $66,891 |
| Immigrants | France | 99.8 /100 | #48 | Exceptional $66,826 |
| Immigrants | Indonesia | 99.8 /100 | #49 | Exceptional $66,694 |
| Immigrants | Turkey | 99.7 /100 | #50 | Exceptional $66,672 |
| Israelis | 99.7 /100 | #51 | Exceptional $66,636 |
| Immigrants | Scotland | 99.7 /100 | #52 | Exceptional $66,620 |
| Immigrants | Pakistan | 99.7 /100 | #53 | Exceptional $66,617 |
| Immigrants | Netherlands | 99.7 /100 | #54 | Exceptional $66,463 |
| Immigrants | Czechoslovakia | 99.7 /100 | #55 | Exceptional $66,376 |
| Laotians | 99.6 /100 | #56 | Exceptional $66,306 |
| Bulgarians | 99.6 /100 | #57 | Exceptional $66,236 |
| Immigrants | Philippines | 99.6 /100 | #58 | Exceptional $66,161 |
| Immigrants | Norway | 99.5 /100 | #59 | Exceptional $66,118 |