Immigrants from Argentina vs Aleut Householder Income Over 65 years
COMPARE
Immigrants from Argentina
Aleut
Householder Income Over 65 years
Householder Income Over 65 years Comparison
Immigrants from Argentina
Aleuts
$63,885
HOUSEHOLDER INCOME OVER 65 YEARS
95.5/ 100
METRIC RATING
106th/ 347
METRIC RANK
$62,708
HOUSEHOLDER INCOME OVER 65 YEARS
86.1/ 100
METRIC RATING
128th/ 347
METRIC RANK
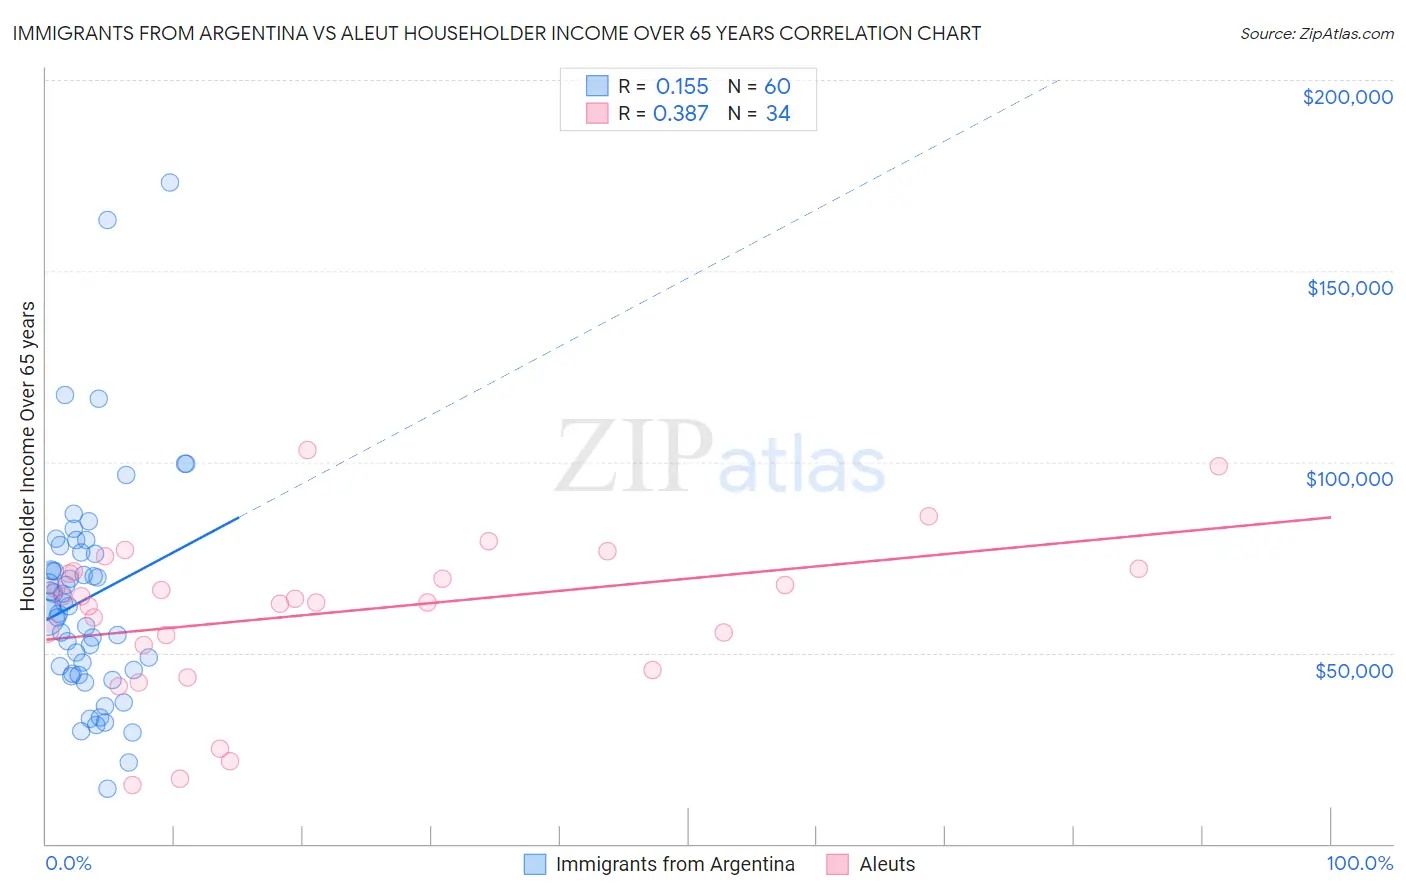
Immigrants from Argentina vs Aleut Householder Income Over 65 years Correlation Chart
The statistical analysis conducted on geographies consisting of 264,021,362 people shows a poor positive correlation between the proportion of Immigrants from Argentina and household income with householder over the age of 65 in the United States with a correlation coefficient (R) of 0.155 and weighted average of $63,885. Similarly, the statistical analysis conducted on geographies consisting of 61,728,641 people shows a mild positive correlation between the proportion of Aleuts and household income with householder over the age of 65 in the United States with a correlation coefficient (R) of 0.387 and weighted average of $62,708, a difference of 1.9%.
Householder Income Over 65 years Correlation Summary
| Measurement | Immigrants from Argentina | Aleut |
| Minimum | $14,333 | $15,500 |
| Maximum | $173,269 | $102,955 |
| Range | $158,936 | $87,455 |
| Mean | $64,355 | $60,420 |
| Median | $62,367 | $63,750 |
| Interquartile 25% (IQ1) | $45,022 | $51,897 |
| Interquartile 75% (IQ3) | $76,116 | $71,452 |
| Interquartile Range (IQR) | $31,094 | $19,555 |
| Standard Deviation (Sample) | $29,179 | $20,386 |
| Standard Deviation (Population) | $28,935 | $20,084 |
Similar Demographics by Householder Income Over 65 years
Demographics Similar to Immigrants from Argentina by Householder Income Over 65 years
In terms of householder income over 65 years, the demographic groups most similar to Immigrants from Argentina are Italian ($63,885, a difference of 0.0%), Immigrants from Cameroon ($63,907, a difference of 0.030%), Pakistani ($63,844, a difference of 0.060%), British ($63,940, a difference of 0.090%), and Chilean ($63,957, a difference of 0.11%).
| Demographics | Rating | Rank | Householder Income Over 65 years |
| Assyrians/Chaldeans/Syriacs | 96.4 /100 | #99 | Exceptional $64,108 |
| Immigrants | South Eastern Asia | 96.3 /100 | #100 | Exceptional $64,089 |
| Immigrants | Italy | 96.2 /100 | #101 | Exceptional $64,065 |
| Chileans | 95.8 /100 | #102 | Exceptional $63,957 |
| British | 95.7 /100 | #103 | Exceptional $63,940 |
| Immigrants | Cameroon | 95.6 /100 | #104 | Exceptional $63,907 |
| Italians | 95.5 /100 | #105 | Exceptional $63,885 |
| Immigrants | Argentina | 95.5 /100 | #106 | Exceptional $63,885 |
| Pakistanis | 95.3 /100 | #107 | Exceptional $63,844 |
| Palestinians | 95.1 /100 | #108 | Exceptional $63,800 |
| Europeans | 95.0 /100 | #109 | Exceptional $63,779 |
| Immigrants | Zimbabwe | 94.3 /100 | #110 | Exceptional $63,643 |
| Immigrants | Spain | 93.7 /100 | #111 | Exceptional $63,540 |
| Syrians | 93.4 /100 | #112 | Exceptional $63,494 |
| Immigrants | Serbia | 92.7 /100 | #113 | Exceptional $63,387 |
Demographics Similar to Aleuts by Householder Income Over 65 years
In terms of householder income over 65 years, the demographic groups most similar to Aleuts are Immigrants from Eastern Europe ($62,693, a difference of 0.020%), Swedish ($62,736, a difference of 0.040%), Peruvian ($62,766, a difference of 0.090%), Basque ($62,653, a difference of 0.090%), and Immigrants from Western Asia ($62,645, a difference of 0.10%).
| Demographics | Rating | Rank | Householder Income Over 65 years |
| Immigrants | Vietnam | 89.5 /100 | #121 | Excellent $63,014 |
| Immigrants | Moldova | 88.7 /100 | #122 | Excellent $62,939 |
| Tlingit-Haida | 88.6 /100 | #123 | Excellent $62,922 |
| Taiwanese | 88.3 /100 | #124 | Excellent $62,894 |
| Soviet Union | 87.8 /100 | #125 | Excellent $62,848 |
| Peruvians | 86.8 /100 | #126 | Excellent $62,766 |
| Swedes | 86.4 /100 | #127 | Excellent $62,736 |
| Aleuts | 86.1 /100 | #128 | Excellent $62,708 |
| Immigrants | Eastern Europe | 85.9 /100 | #129 | Excellent $62,693 |
| Basques | 85.4 /100 | #130 | Excellent $62,653 |
| Immigrants | Western Asia | 85.3 /100 | #131 | Excellent $62,645 |
| Immigrants | Germany | 83.9 /100 | #132 | Excellent $62,544 |
| Immigrants | Northern Africa | 83.6 /100 | #133 | Excellent $62,522 |
| Immigrants | Brazil | 81.2 /100 | #134 | Excellent $62,364 |
| Immigrants | Chile | 81.0 /100 | #135 | Excellent $62,354 |