Creek vs Uruguayan Wage/Income Gap
COMPARE
Creek
Uruguayan
Wage/Income Gap
Wage/Income Gap Comparison
Creek
Uruguayans
27.1%
WAGE/INCOME GAP
3.8/ 100
METRIC RATING
241st/ 347
METRIC RANK
25.2%
WAGE/INCOME GAP
81.3/ 100
METRIC RATING
152nd/ 347
METRIC RANK
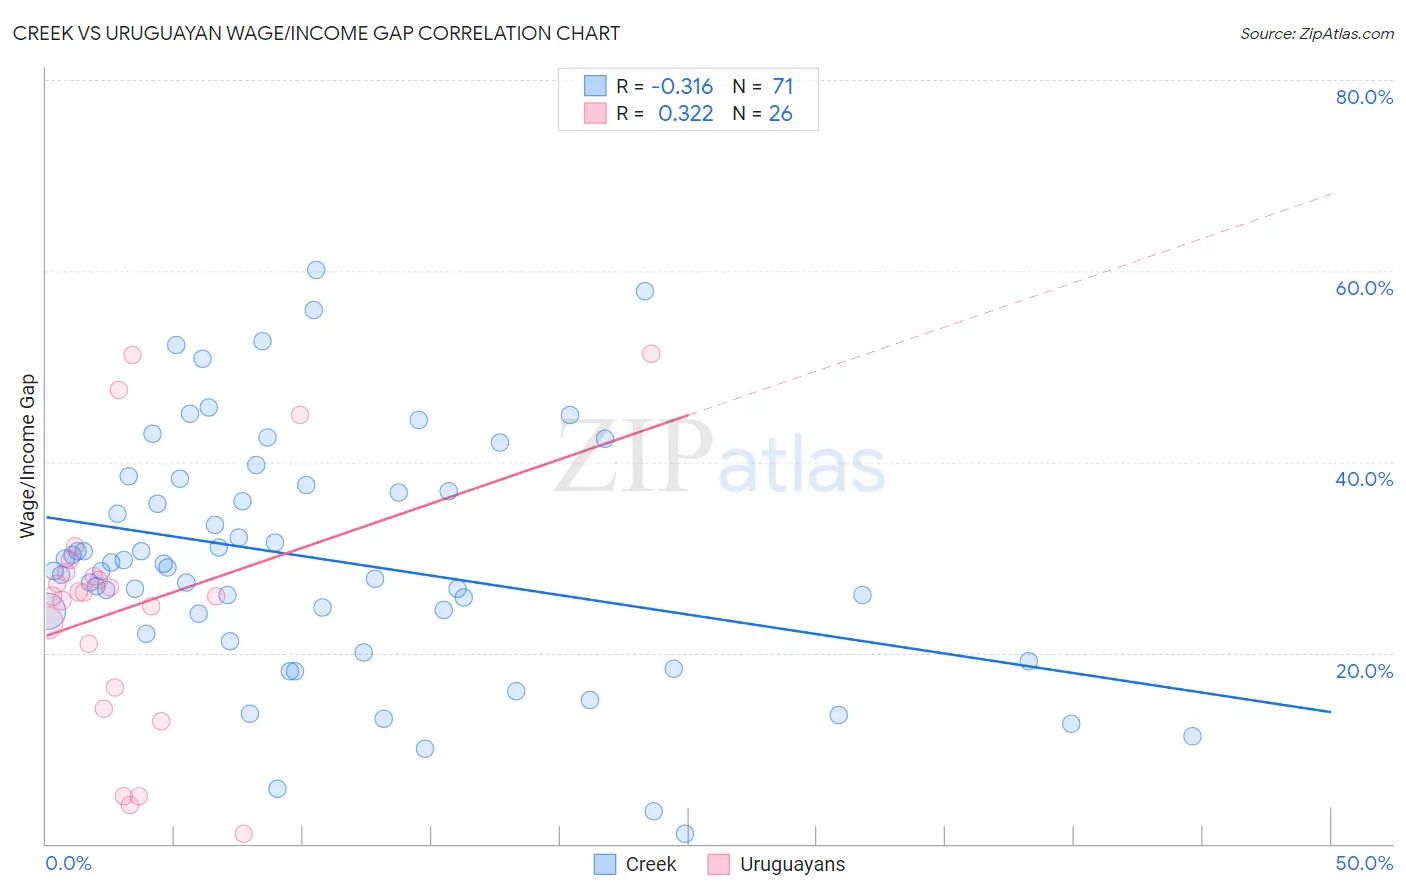
Creek vs Uruguayan Wage/Income Gap Correlation Chart
The statistical analysis conducted on geographies consisting of 178,368,499 people shows a mild negative correlation between the proportion of Creek and wage/income gap percentage in the United States with a correlation coefficient (R) of -0.316 and weighted average of 27.1%. Similarly, the statistical analysis conducted on geographies consisting of 144,770,221 people shows a mild positive correlation between the proportion of Uruguayans and wage/income gap percentage in the United States with a correlation coefficient (R) of 0.322 and weighted average of 25.2%, a difference of 7.9%.
Wage/Income Gap Correlation Summary
| Measurement | Creek | Uruguayan |
| Minimum | 0.99% | 1.1% |
| Maximum | 60.1% | 51.4% |
| Range | 59.1% | 50.3% |
| Mean | 29.8% | 25.1% |
| Median | 28.9% | 26.1% |
| Interquartile 25% (IQ1) | 22.0% | 16.3% |
| Interquartile 75% (IQ3) | 37.6% | 28.4% |
| Interquartile Range (IQR) | 15.5% | 12.1% |
| Standard Deviation (Sample) | 12.7% | 13.5% |
| Standard Deviation (Population) | 12.6% | 13.2% |
Similar Demographics by Wage/Income Gap
Demographics Similar to Creek by Wage/Income Gap
In terms of wage/income gap, the demographic groups most similar to Creek are Immigrants from Europe (27.1%, a difference of 0.020%), Immigrants from Sri Lanka (27.1%, a difference of 0.050%), Spanish (27.1%, a difference of 0.060%), Chickasaw (27.2%, a difference of 0.13%), and Immigrants from the Azores (27.2%, a difference of 0.14%).
| Demographics | Rating | Rank | Wage/Income Gap |
| Immigrants | Pakistan | 4.9 /100 | #234 | Tragic 27.0% |
| Immigrants | Hungary | 4.8 /100 | #235 | Tragic 27.0% |
| Immigrants | Romania | 4.8 /100 | #236 | Tragic 27.0% |
| Immigrants | Eastern Asia | 4.4 /100 | #237 | Tragic 27.1% |
| Osage | 4.4 /100 | #238 | Tragic 27.1% |
| Estonians | 4.3 /100 | #239 | Tragic 27.1% |
| Immigrants | Europe | 3.8 /100 | #240 | Tragic 27.1% |
| Creek | 3.8 /100 | #241 | Tragic 27.1% |
| Immigrants | Sri Lanka | 3.7 /100 | #242 | Tragic 27.1% |
| Spanish | 3.6 /100 | #243 | Tragic 27.1% |
| Chickasaw | 3.5 /100 | #244 | Tragic 27.2% |
| Immigrants | Azores | 3.5 /100 | #245 | Tragic 27.2% |
| Immigrants | Nonimmigrants | 3.3 /100 | #246 | Tragic 27.2% |
| Celtics | 2.8 /100 | #247 | Tragic 27.3% |
| Cypriots | 2.8 /100 | #248 | Tragic 27.3% |
Demographics Similar to Uruguayans by Wage/Income Gap
In terms of wage/income gap, the demographic groups most similar to Uruguayans are Taiwanese (25.1%, a difference of 0.030%), Immigrants (25.1%, a difference of 0.11%), Immigrants from Peru (25.1%, a difference of 0.16%), Iroquois (25.1%, a difference of 0.30%), and Blackfeet (25.2%, a difference of 0.32%).
| Demographics | Rating | Rank | Wage/Income Gap |
| Comanche | 85.2 /100 | #145 | Excellent 25.0% |
| South Americans | 85.2 /100 | #146 | Excellent 25.0% |
| Malaysians | 84.9 /100 | #147 | Excellent 25.0% |
| Iroquois | 83.9 /100 | #148 | Excellent 25.1% |
| Immigrants | Peru | 82.6 /100 | #149 | Excellent 25.1% |
| Immigrants | Immigrants | 82.3 /100 | #150 | Excellent 25.1% |
| Taiwanese | 81.6 /100 | #151 | Excellent 25.1% |
| Uruguayans | 81.3 /100 | #152 | Excellent 25.2% |
| Blackfeet | 78.1 /100 | #153 | Good 25.2% |
| Immigrants | Northern Africa | 78.1 /100 | #154 | Good 25.2% |
| Immigrants | Vietnam | 77.7 /100 | #155 | Good 25.2% |
| Immigrants | Mexico | 76.4 /100 | #156 | Good 25.3% |
| Costa Ricans | 75.8 /100 | #157 | Good 25.3% |
| Immigrants | Zimbabwe | 73.7 /100 | #158 | Good 25.3% |
| Puget Sound Salish | 73.0 /100 | #159 | Good 25.3% |