Creek vs Uruguayan Doctorate Degree
COMPARE
Creek
Uruguayan
Doctorate Degree
Doctorate Degree Comparison
Creek
Uruguayans
1.3%
DOCTORATE DEGREE
0.1/ 100
METRIC RATING
318th/ 347
METRIC RANK
1.8%
DOCTORATE DEGREE
26.2/ 100
METRIC RATING
194th/ 347
METRIC RANK
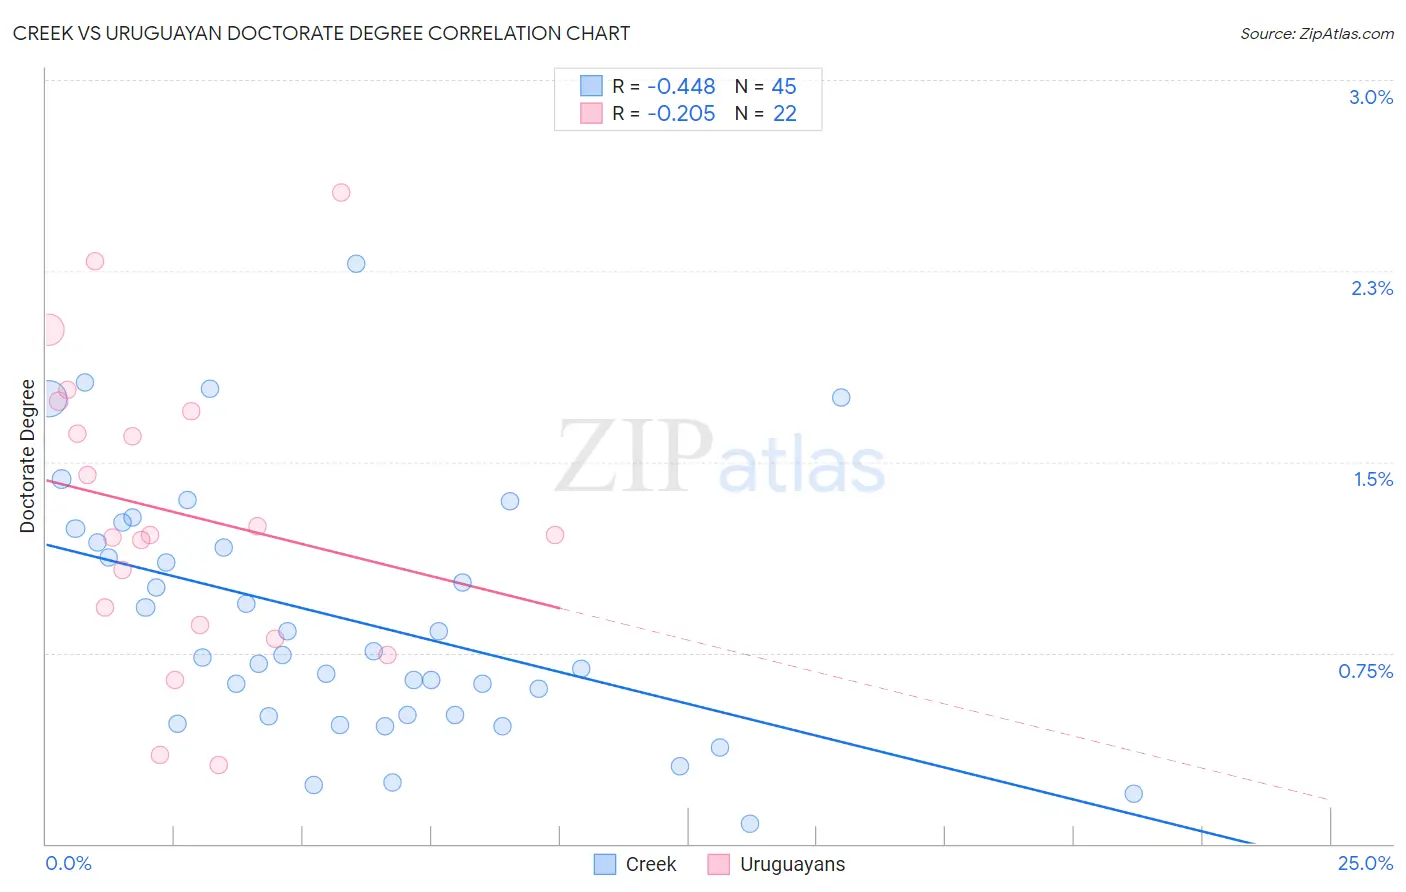
Creek vs Uruguayan Doctorate Degree Correlation Chart
The statistical analysis conducted on geographies consisting of 176,594,001 people shows a moderate negative correlation between the proportion of Creek and percentage of population with at least doctorate degree education in the United States with a correlation coefficient (R) of -0.448 and weighted average of 1.3%. Similarly, the statistical analysis conducted on geographies consisting of 144,575,670 people shows a weak negative correlation between the proportion of Uruguayans and percentage of population with at least doctorate degree education in the United States with a correlation coefficient (R) of -0.205 and weighted average of 1.8%, a difference of 31.4%.
Doctorate Degree Correlation Summary
| Measurement | Creek | Uruguayan |
| Minimum | 0.080% | 0.31% |
| Maximum | 2.3% | 2.6% |
| Range | 2.2% | 2.2% |
| Mean | 0.88% | 1.3% |
| Median | 0.74% | 1.2% |
| Interquartile 25% (IQ1) | 0.50% | 0.86% |
| Interquartile 75% (IQ3) | 1.2% | 1.7% |
| Interquartile Range (IQR) | 0.71% | 0.84% |
| Standard Deviation (Sample) | 0.50% | 0.58% |
| Standard Deviation (Population) | 0.49% | 0.57% |
Similar Demographics by Doctorate Degree
Demographics Similar to Creek by Doctorate Degree
In terms of doctorate degree, the demographic groups most similar to Creek are Immigrants from Micronesia (1.3%, a difference of 0.050%), Navajo (1.4%, a difference of 0.30%), Immigrants from the Azores (1.4%, a difference of 0.51%), Dominican (1.4%, a difference of 0.53%), and Menominee (1.4%, a difference of 0.61%).
| Demographics | Rating | Rank | Doctorate Degree |
| Immigrants | Honduras | 0.1 /100 | #311 | Tragic 1.4% |
| Immigrants | Nicaragua | 0.1 /100 | #312 | Tragic 1.4% |
| Menominee | 0.1 /100 | #313 | Tragic 1.4% |
| Dominicans | 0.1 /100 | #314 | Tragic 1.4% |
| Immigrants | Azores | 0.1 /100 | #315 | Tragic 1.4% |
| Navajo | 0.1 /100 | #316 | Tragic 1.4% |
| Immigrants | Micronesia | 0.1 /100 | #317 | Tragic 1.3% |
| Creek | 0.1 /100 | #318 | Tragic 1.3% |
| Immigrants | Guyana | 0.1 /100 | #319 | Tragic 1.3% |
| Immigrants | St. Vincent and the Grenadines | 0.1 /100 | #320 | Tragic 1.3% |
| Dutch West Indians | 0.1 /100 | #321 | Tragic 1.3% |
| Seminole | 0.1 /100 | #322 | Tragic 1.3% |
| Immigrants | Belize | 0.1 /100 | #323 | Tragic 1.3% |
| Natives/Alaskans | 0.0 /100 | #324 | Tragic 1.3% |
| Pima | 0.0 /100 | #325 | Tragic 1.3% |
Demographics Similar to Uruguayans by Doctorate Degree
In terms of doctorate degree, the demographic groups most similar to Uruguayans are Immigrants from Somalia (1.8%, a difference of 0.15%), German Russian (1.8%, a difference of 0.17%), Subsaharan African (1.8%, a difference of 0.22%), Chinese (1.8%, a difference of 0.23%), and Dutch (1.8%, a difference of 0.24%).
| Demographics | Rating | Rank | Doctorate Degree |
| Czechoslovakians | 33.0 /100 | #187 | Fair 1.8% |
| Germans | 30.5 /100 | #188 | Fair 1.8% |
| French Canadians | 30.2 /100 | #189 | Fair 1.8% |
| Immigrants | Costa Rica | 30.2 /100 | #190 | Fair 1.8% |
| South Americans | 29.5 /100 | #191 | Fair 1.8% |
| Dutch | 27.4 /100 | #192 | Fair 1.8% |
| German Russians | 27.1 /100 | #193 | Fair 1.8% |
| Uruguayans | 26.2 /100 | #194 | Fair 1.8% |
| Immigrants | Somalia | 25.4 /100 | #195 | Fair 1.8% |
| Sub-Saharan Africans | 25.1 /100 | #196 | Fair 1.8% |
| Chinese | 25.1 /100 | #197 | Fair 1.8% |
| Immigrants | Ghana | 24.6 /100 | #198 | Fair 1.8% |
| Immigrants | South America | 23.3 /100 | #199 | Fair 1.8% |
| Whites/Caucasians | 22.8 /100 | #200 | Fair 1.8% |
| Immigrants | Nigeria | 22.4 /100 | #201 | Fair 1.8% |