Creek vs Ugandan Wage/Income Gap
COMPARE
Creek
Ugandan
Wage/Income Gap
Wage/Income Gap Comparison
Creek
Ugandans
27.1%
WAGE/INCOME GAP
3.8/ 100
METRIC RATING
241st/ 347
METRIC RANK
24.1%
WAGE/INCOME GAP
98.3/ 100
METRIC RATING
109th/ 347
METRIC RANK
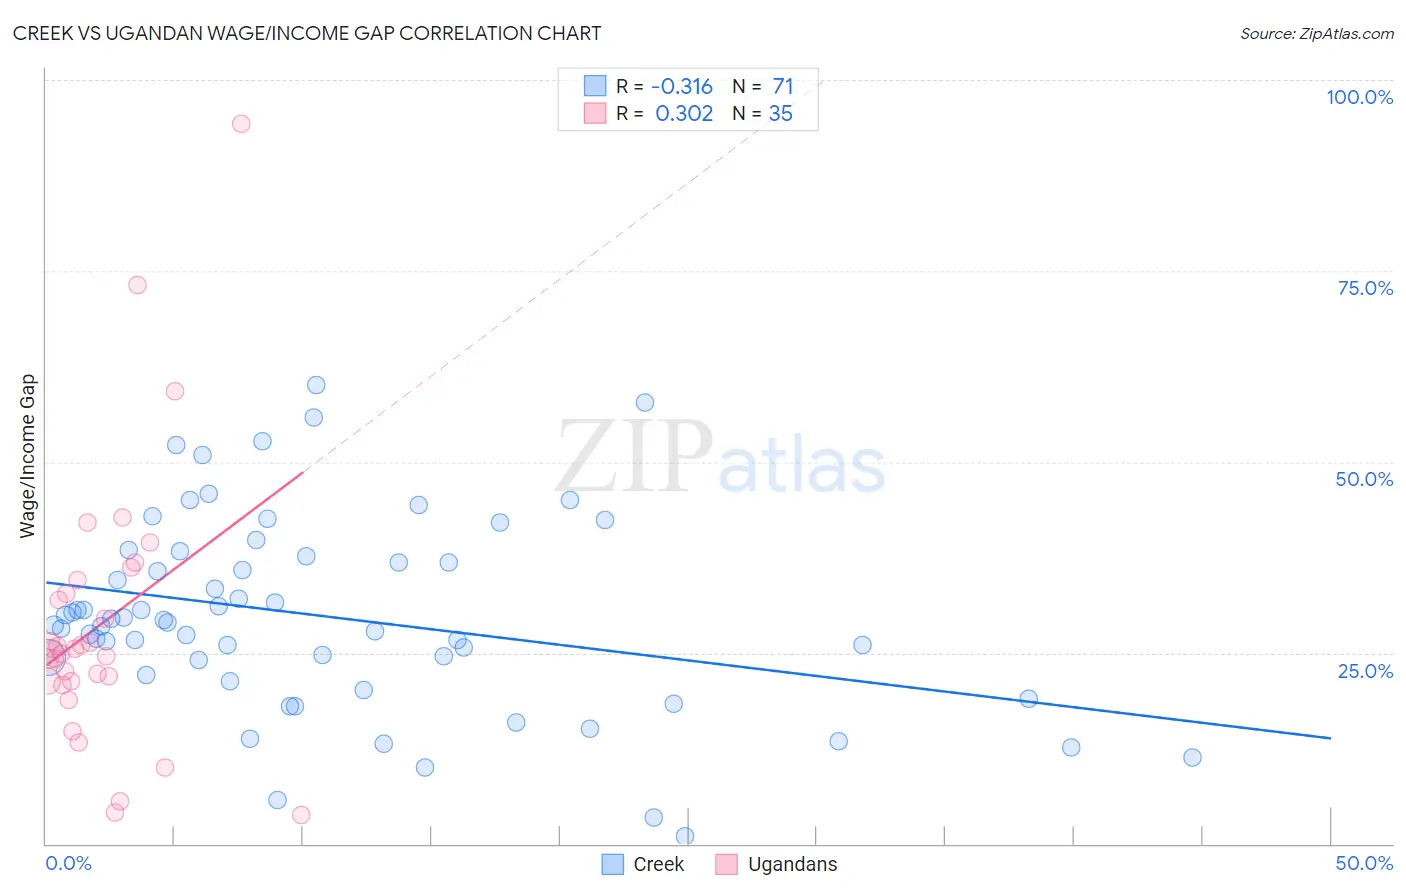
Creek vs Ugandan Wage/Income Gap Correlation Chart
The statistical analysis conducted on geographies consisting of 178,368,499 people shows a mild negative correlation between the proportion of Creek and wage/income gap percentage in the United States with a correlation coefficient (R) of -0.316 and weighted average of 27.1%. Similarly, the statistical analysis conducted on geographies consisting of 94,009,821 people shows a mild positive correlation between the proportion of Ugandans and wage/income gap percentage in the United States with a correlation coefficient (R) of 0.302 and weighted average of 24.1%, a difference of 12.8%.
Wage/Income Gap Correlation Summary
| Measurement | Creek | Ugandan |
| Minimum | 0.99% | 3.7% |
| Maximum | 60.1% | 94.2% |
| Range | 59.1% | 90.5% |
| Mean | 29.8% | 28.8% |
| Median | 28.9% | 25.5% |
| Interquartile 25% (IQ1) | 22.0% | 21.3% |
| Interquartile 75% (IQ3) | 37.6% | 34.5% |
| Interquartile Range (IQR) | 15.5% | 13.3% |
| Standard Deviation (Sample) | 12.7% | 17.9% |
| Standard Deviation (Population) | 12.6% | 17.7% |
Similar Demographics by Wage/Income Gap
Demographics Similar to Creek by Wage/Income Gap
In terms of wage/income gap, the demographic groups most similar to Creek are Immigrants from Europe (27.1%, a difference of 0.020%), Immigrants from Sri Lanka (27.1%, a difference of 0.050%), Spanish (27.1%, a difference of 0.060%), Chickasaw (27.2%, a difference of 0.13%), and Immigrants from the Azores (27.2%, a difference of 0.14%).
| Demographics | Rating | Rank | Wage/Income Gap |
| Immigrants | Pakistan | 4.9 /100 | #234 | Tragic 27.0% |
| Immigrants | Hungary | 4.8 /100 | #235 | Tragic 27.0% |
| Immigrants | Romania | 4.8 /100 | #236 | Tragic 27.0% |
| Immigrants | Eastern Asia | 4.4 /100 | #237 | Tragic 27.1% |
| Osage | 4.4 /100 | #238 | Tragic 27.1% |
| Estonians | 4.3 /100 | #239 | Tragic 27.1% |
| Immigrants | Europe | 3.8 /100 | #240 | Tragic 27.1% |
| Creek | 3.8 /100 | #241 | Tragic 27.1% |
| Immigrants | Sri Lanka | 3.7 /100 | #242 | Tragic 27.1% |
| Spanish | 3.6 /100 | #243 | Tragic 27.1% |
| Chickasaw | 3.5 /100 | #244 | Tragic 27.2% |
| Immigrants | Azores | 3.5 /100 | #245 | Tragic 27.2% |
| Immigrants | Nonimmigrants | 3.3 /100 | #246 | Tragic 27.2% |
| Celtics | 2.8 /100 | #247 | Tragic 27.3% |
| Cypriots | 2.8 /100 | #248 | Tragic 27.3% |
Demographics Similar to Ugandans by Wage/Income Gap
In terms of wage/income gap, the demographic groups most similar to Ugandans are Yaqui (24.0%, a difference of 0.060%), Immigrants from Albania (24.0%, a difference of 0.060%), Immigrants from Morocco (24.1%, a difference of 0.22%), Sudanese (24.0%, a difference of 0.36%), and Moroccan (24.0%, a difference of 0.37%).
| Demographics | Rating | Rank | Wage/Income Gap |
| Immigrants | Laos | 99.0 /100 | #102 | Exceptional 23.8% |
| Tsimshian | 98.9 /100 | #103 | Exceptional 23.9% |
| Tlingit-Haida | 98.7 /100 | #104 | Exceptional 24.0% |
| Moroccans | 98.6 /100 | #105 | Exceptional 24.0% |
| Sudanese | 98.6 /100 | #106 | Exceptional 24.0% |
| Yaqui | 98.4 /100 | #107 | Exceptional 24.0% |
| Immigrants | Albania | 98.4 /100 | #108 | Exceptional 24.0% |
| Ugandans | 98.3 /100 | #109 | Exceptional 24.1% |
| Immigrants | Morocco | 98.1 /100 | #110 | Exceptional 24.1% |
| Soviet Union | 97.6 /100 | #111 | Exceptional 24.2% |
| Immigrants | Colombia | 97.0 /100 | #112 | Exceptional 24.3% |
| Sioux | 96.9 /100 | #113 | Exceptional 24.3% |
| Panamanians | 96.5 /100 | #114 | Exceptional 24.4% |
| Immigrants | Kenya | 96.4 /100 | #115 | Exceptional 24.4% |
| Alaska Natives | 96.0 /100 | #116 | Exceptional 24.4% |