Chinese vs Immigrants from Southern Europe Wage/Income Gap
COMPARE
Chinese
Immigrants from Southern Europe
Wage/Income Gap
Wage/Income Gap Comparison
Chinese
Immigrants from Southern Europe
25.9%
WAGE/INCOME GAP
42.0/ 100
METRIC RATING
178th/ 347
METRIC RANK
26.4%
WAGE/INCOME GAP
17.3/ 100
METRIC RATING
205th/ 347
METRIC RANK
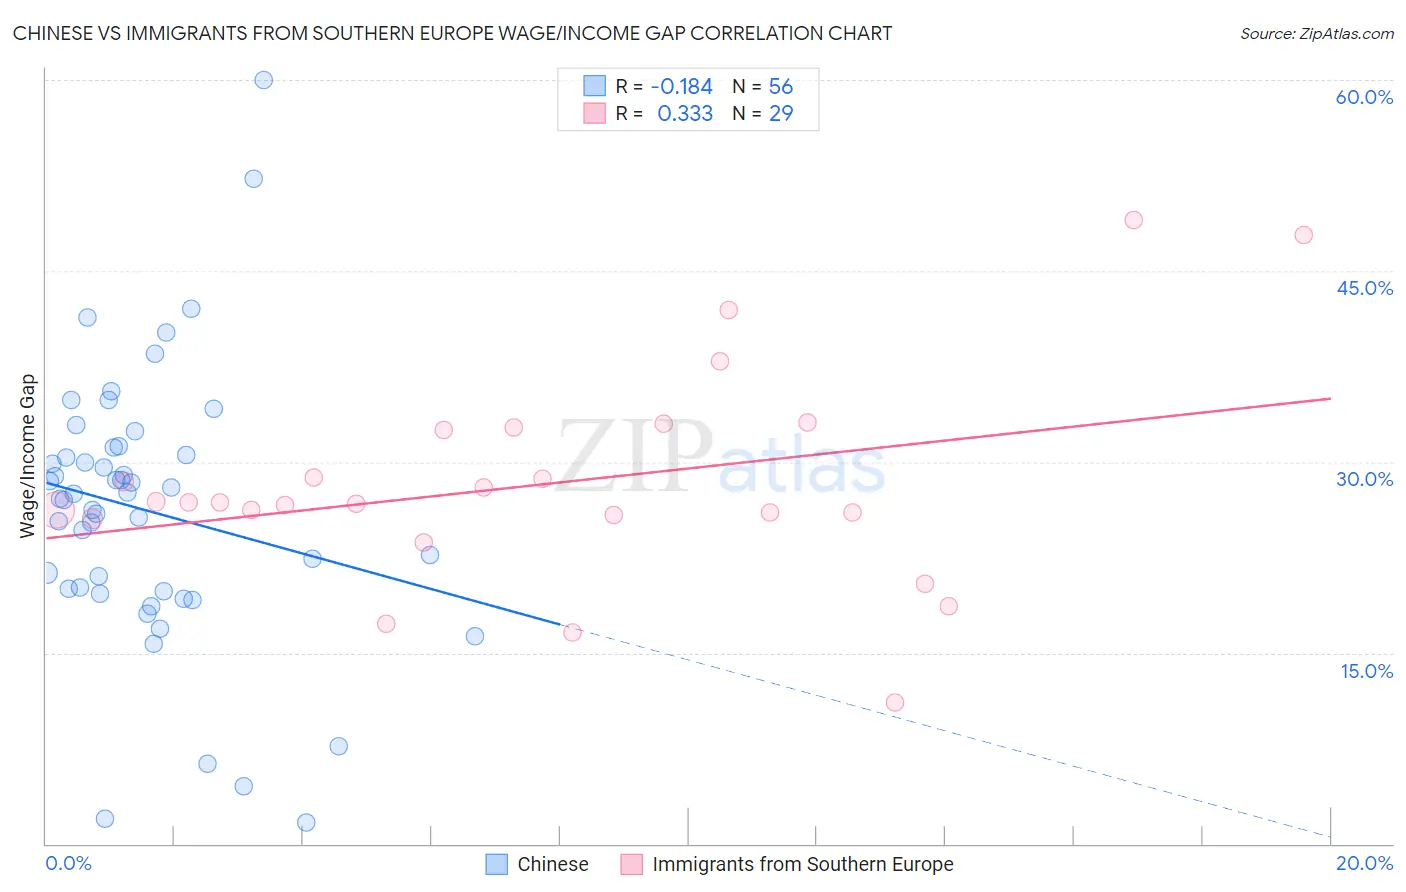
Chinese vs Immigrants from Southern Europe Wage/Income Gap Correlation Chart
The statistical analysis conducted on geographies consisting of 64,807,074 people shows a poor negative correlation between the proportion of Chinese and wage/income gap percentage in the United States with a correlation coefficient (R) of -0.184 and weighted average of 25.9%. Similarly, the statistical analysis conducted on geographies consisting of 402,480,868 people shows a mild positive correlation between the proportion of Immigrants from Southern Europe and wage/income gap percentage in the United States with a correlation coefficient (R) of 0.333 and weighted average of 26.4%, a difference of 2.0%.
Wage/Income Gap Correlation Summary
| Measurement | Chinese | Immigrants from Southern Europe |
| Minimum | 1.7% | 11.1% |
| Maximum | 60.0% | 49.0% |
| Range | 58.3% | 37.9% |
| Mean | 26.2% | 28.2% |
| Median | 27.3% | 26.8% |
| Interquartile 25% (IQ1) | 19.9% | 25.7% |
| Interquartile 75% (IQ3) | 30.9% | 32.6% |
| Interquartile Range (IQR) | 10.9% | 6.9% |
| Standard Deviation (Sample) | 10.8% | 8.3% |
| Standard Deviation (Population) | 10.7% | 8.2% |
Similar Demographics by Wage/Income Gap
Demographics Similar to Chinese by Wage/Income Gap
In terms of wage/income gap, the demographic groups most similar to Chinese are Cambodian (25.8%, a difference of 0.21%), Samoan (26.0%, a difference of 0.23%), Guamanian/Chamorro (26.0%, a difference of 0.27%), Paraguayan (25.8%, a difference of 0.32%), and Sri Lankan (25.8%, a difference of 0.33%).
| Demographics | Rating | Rank | Wage/Income Gap |
| Immigrants | Greece | 56.6 /100 | #171 | Average 25.7% |
| Immigrants | Chile | 53.2 /100 | #172 | Average 25.7% |
| Immigrants | Belarus | 52.9 /100 | #173 | Average 25.7% |
| Alaskan Athabascans | 50.0 /100 | #174 | Average 25.8% |
| Sri Lankans | 47.0 /100 | #175 | Average 25.8% |
| Paraguayans | 46.7 /100 | #176 | Average 25.8% |
| Cambodians | 45.1 /100 | #177 | Average 25.8% |
| Chinese | 42.0 /100 | #178 | Average 25.9% |
| Samoans | 38.6 /100 | #179 | Fair 26.0% |
| Guamanians/Chamorros | 38.0 /100 | #180 | Fair 26.0% |
| Immigrants | Bolivia | 36.4 /100 | #181 | Fair 26.0% |
| Immigrants | Serbia | 35.4 /100 | #182 | Fair 26.0% |
| Immigrants | Kazakhstan | 35.2 /100 | #183 | Fair 26.0% |
| Mexicans | 34.4 /100 | #184 | Fair 26.0% |
| Pakistanis | 33.7 /100 | #185 | Fair 26.1% |
Demographics Similar to Immigrants from Southern Europe by Wage/Income Gap
In terms of wage/income gap, the demographic groups most similar to Immigrants from Southern Europe are Indian (Asian) (26.4%, a difference of 0.090%), Immigrants from Italy (26.5%, a difference of 0.17%), Immigrants from Russia (26.4%, a difference of 0.18%), Laotian (26.4%, a difference of 0.20%), and Immigrants from Eastern Europe (26.4%, a difference of 0.20%).
| Demographics | Rating | Rank | Wage/Income Gap |
| Venezuelans | 21.5 /100 | #198 | Fair 26.3% |
| Dutch West Indians | 21.0 /100 | #199 | Fair 26.3% |
| Delaware | 20.9 /100 | #200 | Fair 26.3% |
| Immigrants | Syria | 19.3 /100 | #201 | Poor 26.4% |
| Laotians | 19.2 /100 | #202 | Poor 26.4% |
| Immigrants | Eastern Europe | 19.2 /100 | #203 | Poor 26.4% |
| Immigrants | Russia | 19.0 /100 | #204 | Poor 26.4% |
| Immigrants | Southern Europe | 17.3 /100 | #205 | Poor 26.4% |
| Indians (Asian) | 16.5 /100 | #206 | Poor 26.4% |
| Immigrants | Italy | 15.8 /100 | #207 | Poor 26.5% |
| Egyptians | 12.7 /100 | #208 | Poor 26.6% |
| Immigrants | Kuwait | 12.6 /100 | #209 | Poor 26.6% |
| Arabs | 12.3 /100 | #210 | Poor 26.6% |
| Mongolians | 11.4 /100 | #211 | Poor 26.6% |
| Iraqis | 11.2 /100 | #212 | Poor 26.6% |