Chinese vs Immigrants from Singapore Wage/Income Gap
COMPARE
Chinese
Immigrants from Singapore
Wage/Income Gap
Wage/Income Gap Comparison
Chinese
Immigrants from Singapore
25.9%
WAGE/INCOME GAP
42.0/ 100
METRIC RATING
178th/ 347
METRIC RANK
28.9%
WAGE/INCOME GAP
0.1/ 100
METRIC RATING
322nd/ 347
METRIC RANK
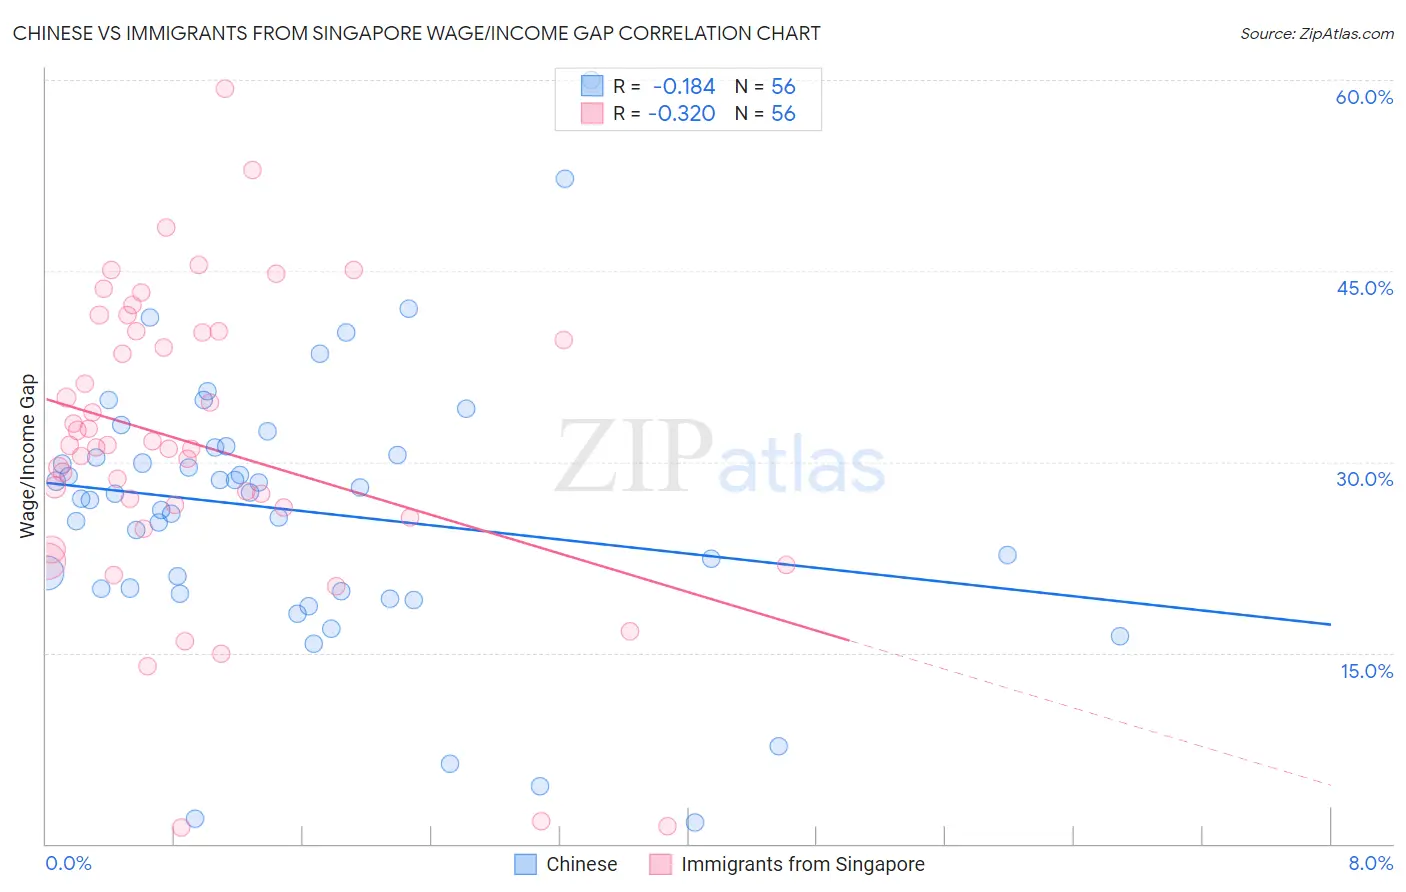
Chinese vs Immigrants from Singapore Wage/Income Gap Correlation Chart
The statistical analysis conducted on geographies consisting of 64,807,074 people shows a poor negative correlation between the proportion of Chinese and wage/income gap percentage in the United States with a correlation coefficient (R) of -0.184 and weighted average of 25.9%. Similarly, the statistical analysis conducted on geographies consisting of 137,510,142 people shows a mild negative correlation between the proportion of Immigrants from Singapore and wage/income gap percentage in the United States with a correlation coefficient (R) of -0.320 and weighted average of 28.9%, a difference of 11.6%.
Wage/Income Gap Correlation Summary
| Measurement | Chinese | Immigrants from Singapore |
| Minimum | 1.7% | 1.3% |
| Maximum | 60.0% | 59.3% |
| Range | 58.3% | 58.0% |
| Mean | 26.2% | 31.3% |
| Median | 27.3% | 31.2% |
| Interquartile 25% (IQ1) | 19.9% | 26.0% |
| Interquartile 75% (IQ3) | 30.9% | 40.2% |
| Interquartile Range (IQR) | 10.9% | 14.2% |
| Standard Deviation (Sample) | 10.8% | 11.9% |
| Standard Deviation (Population) | 10.7% | 11.8% |
Similar Demographics by Wage/Income Gap
Demographics Similar to Chinese by Wage/Income Gap
In terms of wage/income gap, the demographic groups most similar to Chinese are Cambodian (25.8%, a difference of 0.21%), Samoan (26.0%, a difference of 0.23%), Guamanian/Chamorro (26.0%, a difference of 0.27%), Paraguayan (25.8%, a difference of 0.32%), and Sri Lankan (25.8%, a difference of 0.33%).
| Demographics | Rating | Rank | Wage/Income Gap |
| Immigrants | Greece | 56.6 /100 | #171 | Average 25.7% |
| Immigrants | Chile | 53.2 /100 | #172 | Average 25.7% |
| Immigrants | Belarus | 52.9 /100 | #173 | Average 25.7% |
| Alaskan Athabascans | 50.0 /100 | #174 | Average 25.8% |
| Sri Lankans | 47.0 /100 | #175 | Average 25.8% |
| Paraguayans | 46.7 /100 | #176 | Average 25.8% |
| Cambodians | 45.1 /100 | #177 | Average 25.8% |
| Chinese | 42.0 /100 | #178 | Average 25.9% |
| Samoans | 38.6 /100 | #179 | Fair 26.0% |
| Guamanians/Chamorros | 38.0 /100 | #180 | Fair 26.0% |
| Immigrants | Bolivia | 36.4 /100 | #181 | Fair 26.0% |
| Immigrants | Serbia | 35.4 /100 | #182 | Fair 26.0% |
| Immigrants | Kazakhstan | 35.2 /100 | #183 | Fair 26.0% |
| Mexicans | 34.4 /100 | #184 | Fair 26.0% |
| Pakistanis | 33.7 /100 | #185 | Fair 26.1% |
Demographics Similar to Immigrants from Singapore by Wage/Income Gap
In terms of wage/income gap, the demographic groups most similar to Immigrants from Singapore are Welsh (28.9%, a difference of 0.020%), British (28.9%, a difference of 0.080%), Norwegian (29.0%, a difference of 0.11%), Slovak (28.9%, a difference of 0.15%), and Croatian (29.0%, a difference of 0.23%).
| Demographics | Rating | Rank | Wage/Income Gap |
| Maltese | 0.1 /100 | #315 | Tragic 28.7% |
| Lithuanians | 0.1 /100 | #316 | Tragic 28.7% |
| Belgians | 0.1 /100 | #317 | Tragic 28.8% |
| Basques | 0.1 /100 | #318 | Tragic 28.8% |
| Slovaks | 0.1 /100 | #319 | Tragic 28.9% |
| British | 0.1 /100 | #320 | Tragic 28.9% |
| Welsh | 0.1 /100 | #321 | Tragic 28.9% |
| Immigrants | Singapore | 0.1 /100 | #322 | Tragic 28.9% |
| Norwegians | 0.1 /100 | #323 | Tragic 29.0% |
| Croatians | 0.0 /100 | #324 | Tragic 29.0% |
| Hungarians | 0.0 /100 | #325 | Tragic 29.0% |
| Immigrants | Belgium | 0.0 /100 | #326 | Tragic 29.0% |
| Immigrants | Iran | 0.0 /100 | #327 | Tragic 29.1% |
| Scandinavians | 0.0 /100 | #328 | Tragic 29.1% |
| Scottish | 0.0 /100 | #329 | Tragic 29.1% |