Australian vs Immigrants from Southern Europe Wage/Income Gap
COMPARE
Australian
Immigrants from Southern Europe
Wage/Income Gap
Wage/Income Gap Comparison
Australians
Immigrants from Southern Europe
28.2%
WAGE/INCOME GAP
0.3/ 100
METRIC RATING
290th/ 347
METRIC RANK
26.4%
WAGE/INCOME GAP
17.3/ 100
METRIC RATING
205th/ 347
METRIC RANK
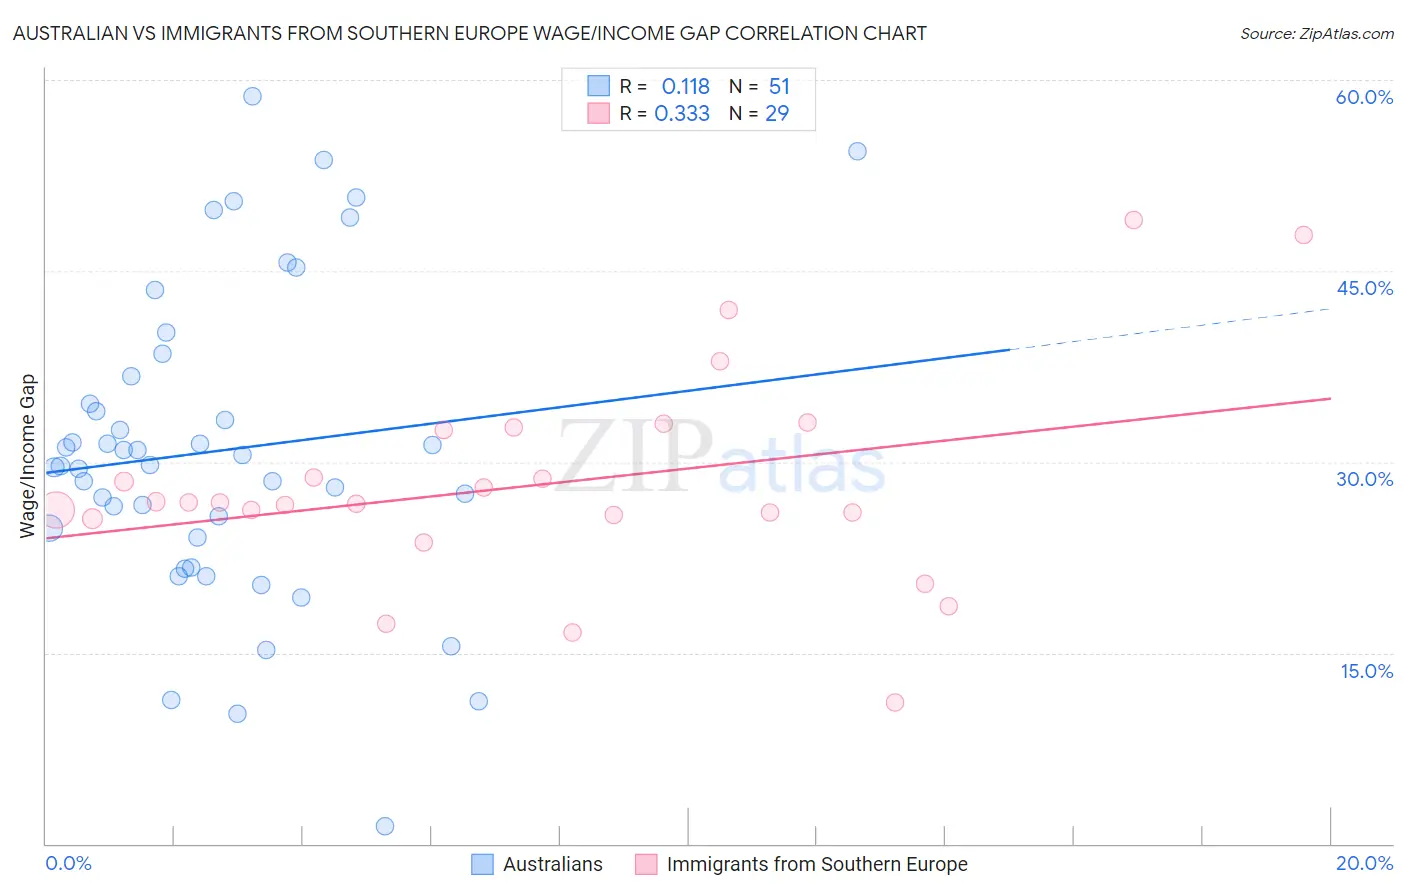
Australian vs Immigrants from Southern Europe Wage/Income Gap Correlation Chart
The statistical analysis conducted on geographies consisting of 224,081,810 people shows a poor positive correlation between the proportion of Australians and wage/income gap percentage in the United States with a correlation coefficient (R) of 0.118 and weighted average of 28.2%. Similarly, the statistical analysis conducted on geographies consisting of 402,480,868 people shows a mild positive correlation between the proportion of Immigrants from Southern Europe and wage/income gap percentage in the United States with a correlation coefficient (R) of 0.333 and weighted average of 26.4%, a difference of 6.6%.
Wage/Income Gap Correlation Summary
| Measurement | Australian | Immigrants from Southern Europe |
| Minimum | 1.3% | 11.1% |
| Maximum | 58.7% | 49.0% |
| Range | 57.4% | 37.9% |
| Mean | 30.9% | 28.2% |
| Median | 29.8% | 26.8% |
| Interquartile 25% (IQ1) | 24.1% | 25.7% |
| Interquartile 75% (IQ3) | 36.7% | 32.6% |
| Interquartile Range (IQR) | 12.6% | 6.9% |
| Standard Deviation (Sample) | 12.2% | 8.3% |
| Standard Deviation (Population) | 12.1% | 8.2% |
Similar Demographics by Wage/Income Gap
Demographics Similar to Australians by Wage/Income Gap
In terms of wage/income gap, the demographic groups most similar to Australians are Czechoslovakian (28.2%, a difference of 0.070%), Canadian (28.1%, a difference of 0.090%), Immigrants from Australia (28.2%, a difference of 0.12%), Choctaw (28.1%, a difference of 0.13%), and Okinawan (28.1%, a difference of 0.16%).
| Demographics | Rating | Rank | Wage/Income Gap |
| French Canadians | 0.4 /100 | #283 | Tragic 28.1% |
| Immigrants | Sweden | 0.4 /100 | #284 | Tragic 28.1% |
| Italians | 0.4 /100 | #285 | Tragic 28.1% |
| Immigrants | Austria | 0.4 /100 | #286 | Tragic 28.1% |
| Okinawans | 0.4 /100 | #287 | Tragic 28.1% |
| Choctaw | 0.4 /100 | #288 | Tragic 28.1% |
| Canadians | 0.3 /100 | #289 | Tragic 28.1% |
| Australians | 0.3 /100 | #290 | Tragic 28.2% |
| Czechoslovakians | 0.3 /100 | #291 | Tragic 28.2% |
| Immigrants | Australia | 0.3 /100 | #292 | Tragic 28.2% |
| Immigrants | Israel | 0.3 /100 | #293 | Tragic 28.2% |
| Greeks | 0.3 /100 | #294 | Tragic 28.2% |
| Slovenes | 0.3 /100 | #295 | Tragic 28.3% |
| Northern Europeans | 0.3 /100 | #296 | Tragic 28.3% |
| Immigrants | North America | 0.2 /100 | #297 | Tragic 28.4% |
Demographics Similar to Immigrants from Southern Europe by Wage/Income Gap
In terms of wage/income gap, the demographic groups most similar to Immigrants from Southern Europe are Indian (Asian) (26.4%, a difference of 0.090%), Immigrants from Italy (26.5%, a difference of 0.17%), Immigrants from Russia (26.4%, a difference of 0.18%), Laotian (26.4%, a difference of 0.20%), and Immigrants from Eastern Europe (26.4%, a difference of 0.20%).
| Demographics | Rating | Rank | Wage/Income Gap |
| Venezuelans | 21.5 /100 | #198 | Fair 26.3% |
| Dutch West Indians | 21.0 /100 | #199 | Fair 26.3% |
| Delaware | 20.9 /100 | #200 | Fair 26.3% |
| Immigrants | Syria | 19.3 /100 | #201 | Poor 26.4% |
| Laotians | 19.2 /100 | #202 | Poor 26.4% |
| Immigrants | Eastern Europe | 19.2 /100 | #203 | Poor 26.4% |
| Immigrants | Russia | 19.0 /100 | #204 | Poor 26.4% |
| Immigrants | Southern Europe | 17.3 /100 | #205 | Poor 26.4% |
| Indians (Asian) | 16.5 /100 | #206 | Poor 26.4% |
| Immigrants | Italy | 15.8 /100 | #207 | Poor 26.5% |
| Egyptians | 12.7 /100 | #208 | Poor 26.6% |
| Immigrants | Kuwait | 12.6 /100 | #209 | Poor 26.6% |
| Arabs | 12.3 /100 | #210 | Poor 26.6% |
| Mongolians | 11.4 /100 | #211 | Poor 26.6% |
| Iraqis | 11.2 /100 | #212 | Poor 26.6% |