Central American Indian vs Nicaraguan Female Poverty Among 25-34 Year Olds
COMPARE
Central American Indian
Nicaraguan
Female Poverty Among 25-34 Year Olds
Female Poverty Among 25-34 Year Olds Comparison
Central American Indians
Nicaraguans
18.2%
FEMALE POVERTY AMONG 25-34 YEAR OLDS
0.0/ 100
METRIC RATING
322nd/ 347
METRIC RANK
14.5%
FEMALE POVERTY AMONG 25-34 YEAR OLDS
3.3/ 100
METRIC RATING
226th/ 347
METRIC RANK
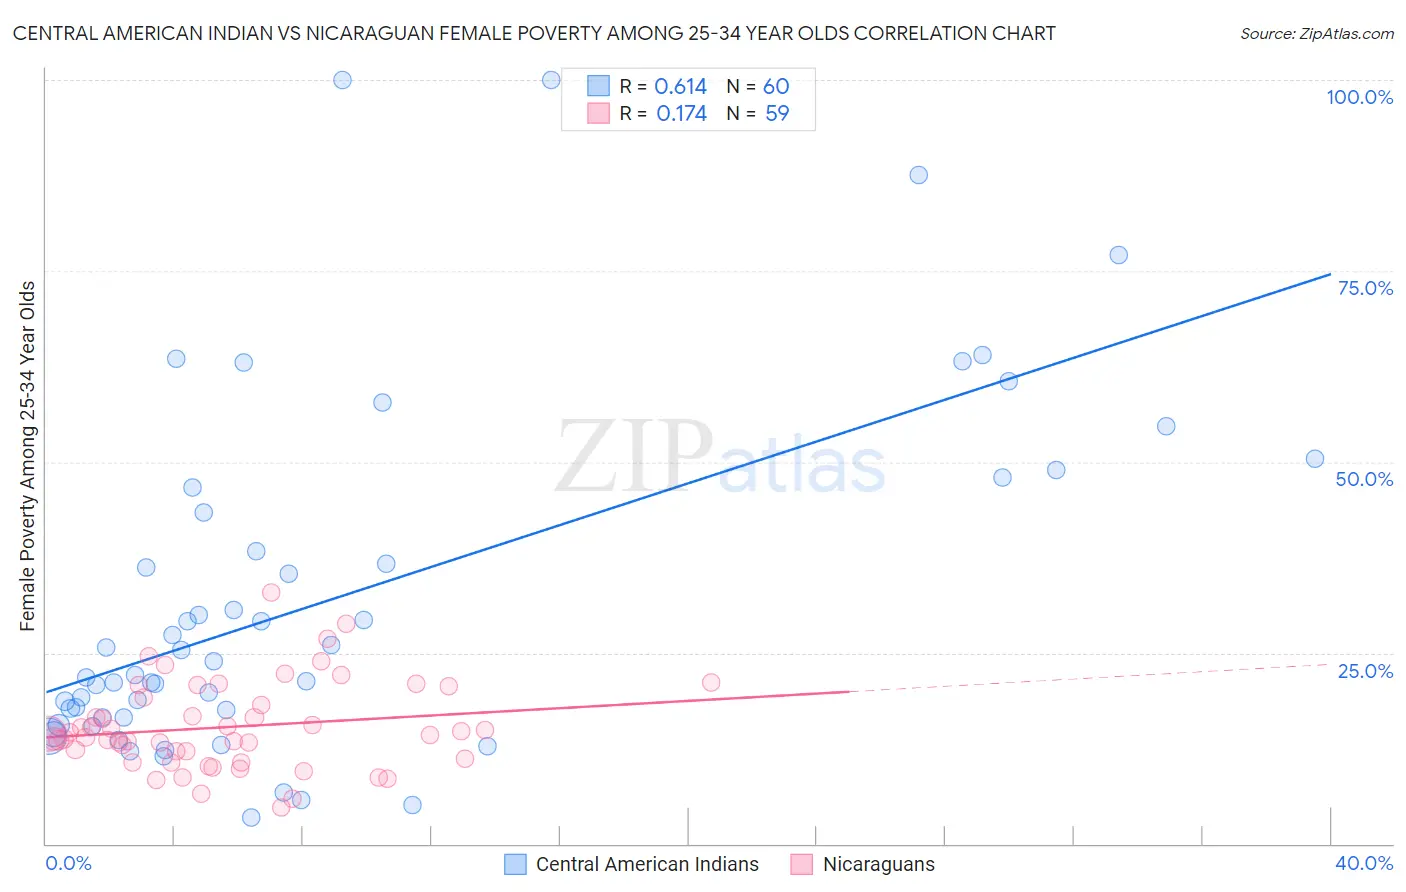
Central American Indian vs Nicaraguan Female Poverty Among 25-34 Year Olds Correlation Chart
The statistical analysis conducted on geographies consisting of 323,546,526 people shows a significant positive correlation between the proportion of Central American Indians and poverty level among females between the ages 25 and 34 in the United States with a correlation coefficient (R) of 0.614 and weighted average of 18.2%. Similarly, the statistical analysis conducted on geographies consisting of 283,781,399 people shows a poor positive correlation between the proportion of Nicaraguans and poverty level among females between the ages 25 and 34 in the United States with a correlation coefficient (R) of 0.174 and weighted average of 14.5%, a difference of 25.7%.
Female Poverty Among 25-34 Year Olds Correlation Summary
| Measurement | Central American Indian | Nicaraguan |
| Minimum | 3.4% | 4.7% |
| Maximum | 100.0% | 32.8% |
| Range | 96.6% | 28.1% |
| Mean | 32.0% | 15.3% |
| Median | 23.0% | 14.3% |
| Interquartile 25% (IQ1) | 16.6% | 11.1% |
| Interquartile 75% (IQ3) | 45.0% | 19.2% |
| Interquartile Range (IQR) | 28.4% | 8.1% |
| Standard Deviation (Sample) | 22.8% | 5.7% |
| Standard Deviation (Population) | 22.6% | 5.7% |
Similar Demographics by Female Poverty Among 25-34 Year Olds
Demographics Similar to Central American Indians by Female Poverty Among 25-34 Year Olds
In terms of female poverty among 25-34 year olds, the demographic groups most similar to Central American Indians are Seminole (18.3%, a difference of 0.32%), Choctaw (18.1%, a difference of 0.84%), Chippewa (18.0%, a difference of 1.1%), Dutch West Indian (18.4%, a difference of 1.3%), and Menominee (18.0%, a difference of 1.3%).
| Demographics | Rating | Rank | Female Poverty Among 25-34 Year Olds |
| Yakama | 0.0 /100 | #315 | Tragic 17.6% |
| Dominicans | 0.0 /100 | #316 | Tragic 17.6% |
| Arapaho | 0.0 /100 | #317 | Tragic 17.8% |
| Ute | 0.0 /100 | #318 | Tragic 17.9% |
| Menominee | 0.0 /100 | #319 | Tragic 18.0% |
| Chippewa | 0.0 /100 | #320 | Tragic 18.0% |
| Choctaw | 0.0 /100 | #321 | Tragic 18.1% |
| Central American Indians | 0.0 /100 | #322 | Tragic 18.2% |
| Seminole | 0.0 /100 | #323 | Tragic 18.3% |
| Dutch West Indians | 0.0 /100 | #324 | Tragic 18.4% |
| Inupiat | 0.0 /100 | #325 | Tragic 18.5% |
| Blacks/African Americans | 0.0 /100 | #326 | Tragic 18.9% |
| Cheyenne | 0.0 /100 | #327 | Tragic 19.1% |
| Alaskan Athabascans | 0.0 /100 | #328 | Tragic 19.1% |
| Creek | 0.0 /100 | #329 | Tragic 19.2% |
Demographics Similar to Nicaraguans by Female Poverty Among 25-34 Year Olds
In terms of female poverty among 25-34 year olds, the demographic groups most similar to Nicaraguans are Immigrants from Barbados (14.5%, a difference of 0.080%), Celtic (14.5%, a difference of 0.30%), Immigrants from Sudan (14.4%, a difference of 0.40%), Nigerian (14.4%, a difference of 0.47%), and Vietnamese (14.6%, a difference of 0.47%).
| Demographics | Rating | Rank | Female Poverty Among 25-34 Year Olds |
| Ecuadorians | 5.2 /100 | #219 | Tragic 14.3% |
| Ghanaians | 4.8 /100 | #220 | Tragic 14.4% |
| Sudanese | 4.4 /100 | #221 | Tragic 14.4% |
| Immigrants | Portugal | 4.3 /100 | #222 | Tragic 14.4% |
| Nigerians | 4.2 /100 | #223 | Tragic 14.4% |
| Immigrants | Sudan | 4.0 /100 | #224 | Tragic 14.4% |
| Immigrants | Barbados | 3.4 /100 | #225 | Tragic 14.5% |
| Nicaraguans | 3.3 /100 | #226 | Tragic 14.5% |
| Celtics | 2.8 /100 | #227 | Tragic 14.5% |
| Vietnamese | 2.6 /100 | #228 | Tragic 14.6% |
| Spanish | 2.5 /100 | #229 | Tragic 14.6% |
| Spaniards | 2.3 /100 | #230 | Tragic 14.6% |
| Delaware | 2.3 /100 | #231 | Tragic 14.6% |
| Immigrants | Ecuador | 1.9 /100 | #232 | Tragic 14.6% |
| Whites/Caucasians | 1.8 /100 | #233 | Tragic 14.7% |