Central American Indian vs Nicaraguan In Labor Force | Age 35-44
COMPARE
Central American Indian
Nicaraguan
In Labor Force | Age 35-44
In Labor Force | Age 35-44 Comparison
Central American Indians
Nicaraguans
82.5%
IN LABOR FORCE | AGE 35-44
0.0/ 100
METRIC RATING
300th/ 347
METRIC RANK
84.1%
IN LABOR FORCE | AGE 35-44
12.1/ 100
METRIC RATING
216th/ 347
METRIC RANK
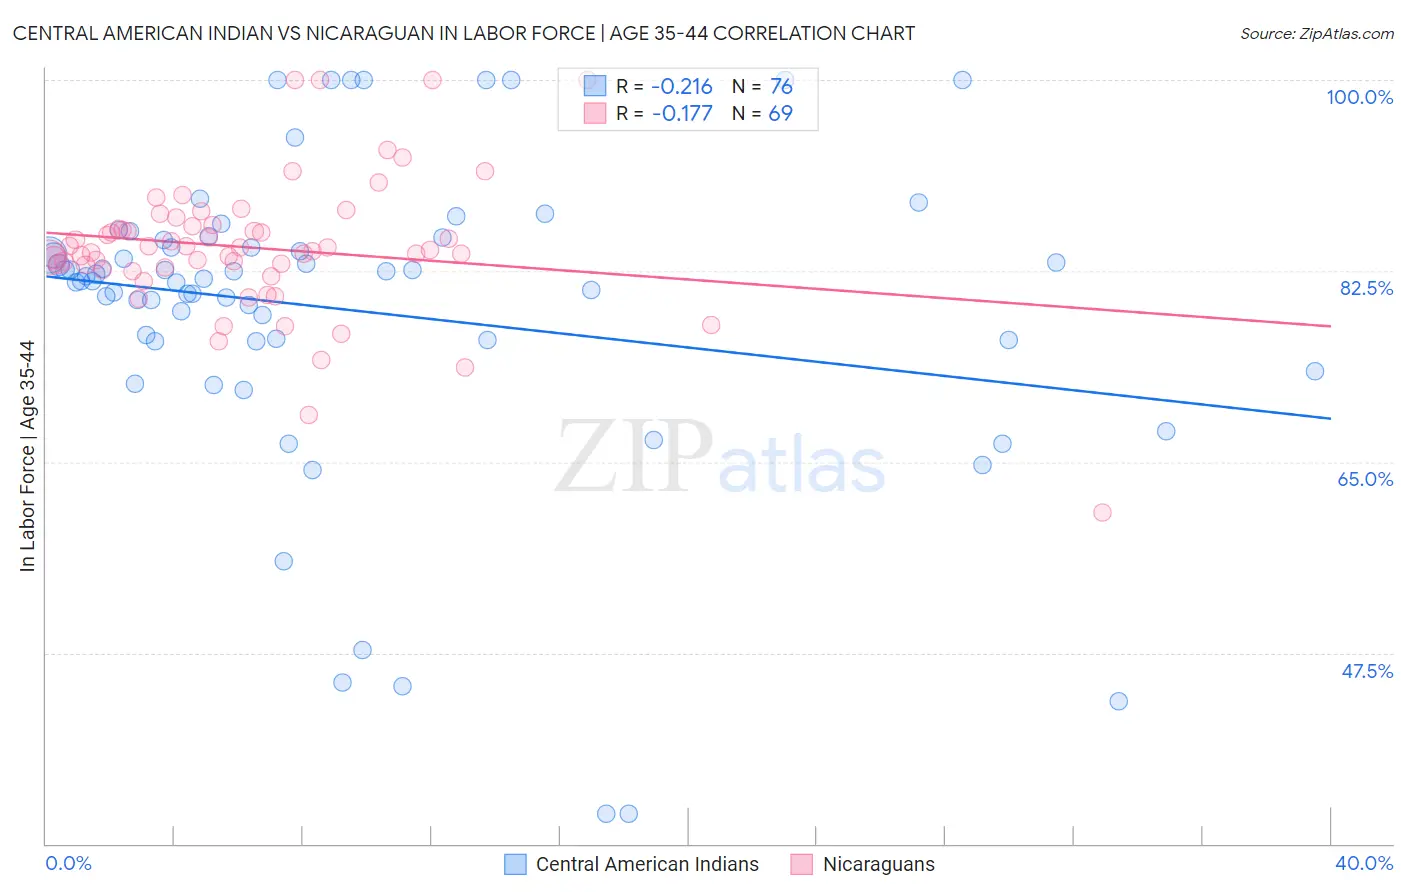
Central American Indian vs Nicaraguan In Labor Force | Age 35-44 Correlation Chart
The statistical analysis conducted on geographies consisting of 326,103,474 people shows a weak negative correlation between the proportion of Central American Indians and labor force participation rate among population between the ages 35 and 44 in the United States with a correlation coefficient (R) of -0.216 and weighted average of 82.5%. Similarly, the statistical analysis conducted on geographies consisting of 285,645,382 people shows a poor negative correlation between the proportion of Nicaraguans and labor force participation rate among population between the ages 35 and 44 in the United States with a correlation coefficient (R) of -0.177 and weighted average of 84.1%, a difference of 1.9%.
In Labor Force | Age 35-44 Correlation Summary
| Measurement | Central American Indian | Nicaraguan |
| Minimum | 32.8% | 60.4% |
| Maximum | 100.0% | 100.0% |
| Range | 67.2% | 39.6% |
| Mean | 78.8% | 84.6% |
| Median | 81.7% | 84.4% |
| Interquartile 25% (IQ1) | 76.1% | 82.7% |
| Interquartile 75% (IQ3) | 85.0% | 86.7% |
| Interquartile Range (IQR) | 8.9% | 3.9% |
| Standard Deviation (Sample) | 14.3% | 6.4% |
| Standard Deviation (Population) | 14.3% | 6.4% |
Similar Demographics by In Labor Force | Age 35-44
Demographics Similar to Central American Indians by In Labor Force | Age 35-44
In terms of in labor force | age 35-44, the demographic groups most similar to Central American Indians are Spanish American Indian (82.5%, a difference of 0.020%), Tlingit-Haida (82.5%, a difference of 0.070%), Ottawa (82.6%, a difference of 0.080%), Hmong (82.6%, a difference of 0.090%), and Mexican American Indian (82.6%, a difference of 0.10%).
| Demographics | Rating | Rank | In Labor Force | Age 35-44 |
| Spanish Americans | 0.0 /100 | #293 | Tragic 82.8% |
| Potawatomi | 0.0 /100 | #294 | Tragic 82.7% |
| Immigrants | Lebanon | 0.0 /100 | #295 | Tragic 82.7% |
| Mexican American Indians | 0.0 /100 | #296 | Tragic 82.6% |
| Hmong | 0.0 /100 | #297 | Tragic 82.6% |
| Ottawa | 0.0 /100 | #298 | Tragic 82.6% |
| Tlingit-Haida | 0.0 /100 | #299 | Tragic 82.5% |
| Central American Indians | 0.0 /100 | #300 | Tragic 82.5% |
| Spanish American Indians | 0.0 /100 | #301 | Tragic 82.5% |
| Americans | 0.0 /100 | #302 | Tragic 82.4% |
| Nepalese | 0.0 /100 | #303 | Tragic 82.4% |
| Marshallese | 0.0 /100 | #304 | Tragic 82.4% |
| Shoshone | 0.0 /100 | #305 | Tragic 82.2% |
| Blacks/African Americans | 0.0 /100 | #306 | Tragic 82.2% |
| Hispanics or Latinos | 0.0 /100 | #307 | Tragic 82.1% |
Demographics Similar to Nicaraguans by In Labor Force | Age 35-44
In terms of in labor force | age 35-44, the demographic groups most similar to Nicaraguans are European (84.1%, a difference of 0.0%), Immigrants from Norway (84.1%, a difference of 0.010%), Bangladeshi (84.1%, a difference of 0.020%), Immigrants from Barbados (84.1%, a difference of 0.020%), and Israeli (84.1%, a difference of 0.030%).
| Demographics | Rating | Rank | In Labor Force | Age 35-44 |
| Swiss | 17.4 /100 | #209 | Poor 84.2% |
| New Zealanders | 16.2 /100 | #210 | Poor 84.1% |
| Immigrants | Ecuador | 15.2 /100 | #211 | Poor 84.1% |
| Israelis | 14.0 /100 | #212 | Poor 84.1% |
| Bangladeshis | 13.7 /100 | #213 | Poor 84.1% |
| Immigrants | Barbados | 13.2 /100 | #214 | Poor 84.1% |
| Europeans | 12.2 /100 | #215 | Poor 84.1% |
| Nicaraguans | 12.1 /100 | #216 | Poor 84.1% |
| Immigrants | Norway | 11.7 /100 | #217 | Poor 84.1% |
| Immigrants | Nicaragua | 9.4 /100 | #218 | Tragic 84.1% |
| Sub-Saharan Africans | 9.3 /100 | #219 | Tragic 84.1% |
| French | 7.5 /100 | #220 | Tragic 84.0% |
| Icelanders | 6.7 /100 | #221 | Tragic 84.0% |
| Assyrians/Chaldeans/Syriacs | 6.6 /100 | #222 | Tragic 84.0% |
| Immigrants | Panama | 6.4 /100 | #223 | Tragic 84.0% |