Black/African American vs Northern European Householder Income Under 25 years
COMPARE
Black/African American
Northern European
Householder Income Under 25 years
Householder Income Under 25 years Comparison
Blacks/African Americans
Northern Europeans
$44,381
HOUSEHOLDER INCOME UNDER 25 YEARS
0.0/ 100
METRIC RATING
340th/ 347
METRIC RANK
$51,678
HOUSEHOLDER INCOME UNDER 25 YEARS
22.2/ 100
METRIC RATING
188th/ 347
METRIC RANK
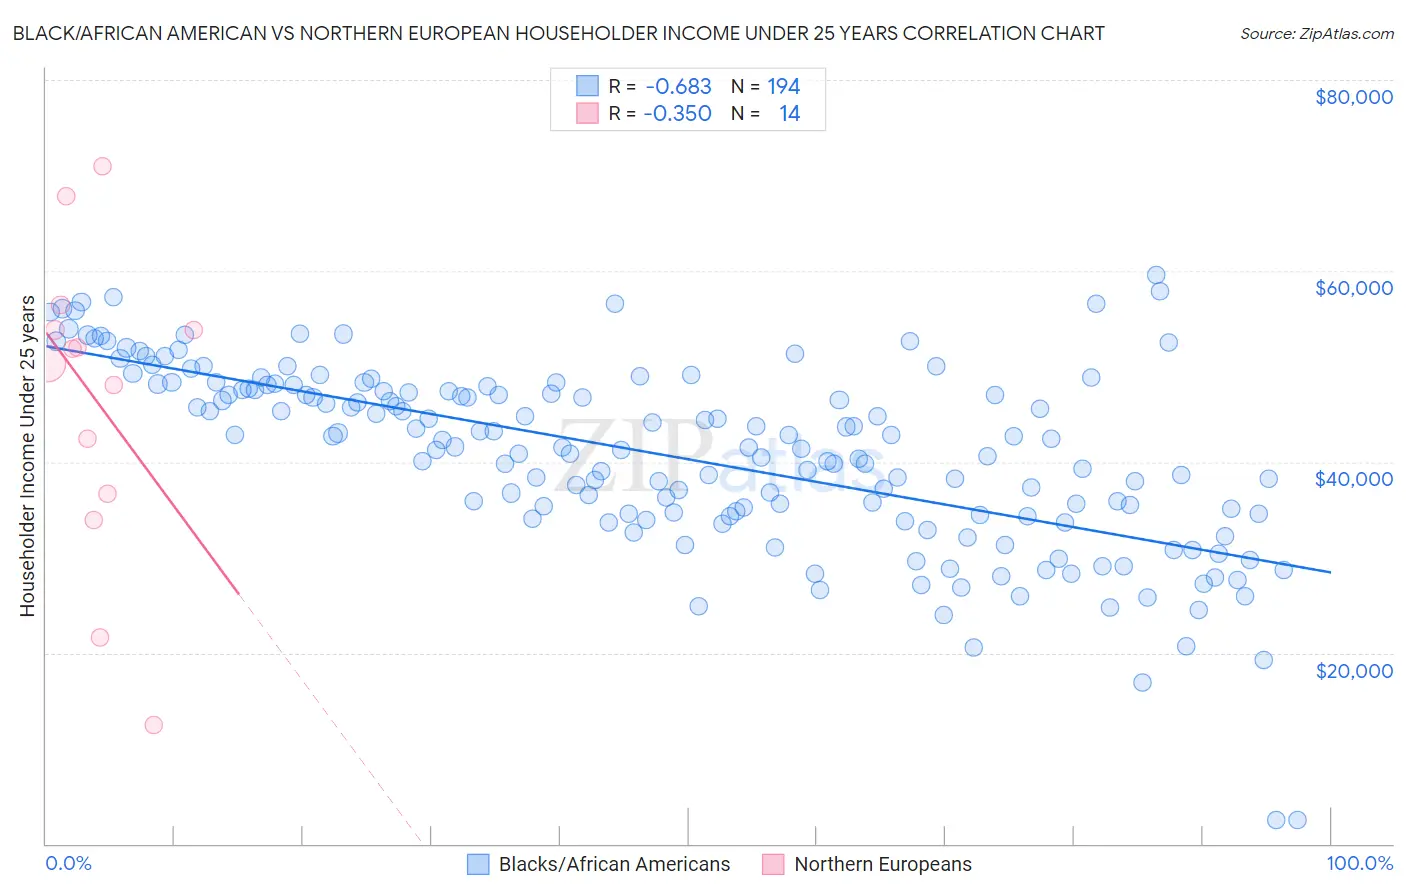
Black/African American vs Northern European Householder Income Under 25 years Correlation Chart
The statistical analysis conducted on geographies consisting of 438,583,318 people shows a significant negative correlation between the proportion of Blacks/African Americans and household income with householder under the age of 25 in the United States with a correlation coefficient (R) of -0.683 and weighted average of $44,381. Similarly, the statistical analysis conducted on geographies consisting of 340,537,384 people shows a mild negative correlation between the proportion of Northern Europeans and household income with householder under the age of 25 in the United States with a correlation coefficient (R) of -0.350 and weighted average of $51,678, a difference of 16.4%.
Householder Income Under 25 years Correlation Summary
| Measurement | Black/African American | Northern European |
| Minimum | $2,499 | $12,500 |
| Maximum | $59,638 | $71,017 |
| Range | $57,139 | $58,517 |
| Mean | $40,625 | $46,566 |
| Median | $41,554 | $51,044 |
| Interquartile 25% (IQ1) | $34,429 | $36,723 |
| Interquartile 75% (IQ3) | $47,684 | $53,780 |
| Interquartile Range (IQR) | $13,255 | $17,057 |
| Standard Deviation (Sample) | $9,747 | $16,138 |
| Standard Deviation (Population) | $9,722 | $15,551 |
Similar Demographics by Householder Income Under 25 years
Demographics Similar to Blacks/African Americans by Householder Income Under 25 years
In terms of householder income under 25 years, the demographic groups most similar to Blacks/African Americans are Houma ($44,356, a difference of 0.060%), Kiowa ($44,733, a difference of 0.79%), Chickasaw ($44,763, a difference of 0.86%), Arapaho ($44,003, a difference of 0.86%), and Pueblo ($45,018, a difference of 1.4%).
| Demographics | Rating | Rank | Householder Income Under 25 years |
| Creek | 0.0 /100 | #333 | Tragic $45,371 |
| Cajuns | 0.0 /100 | #334 | Tragic $45,338 |
| Cheyenne | 0.0 /100 | #335 | Tragic $45,275 |
| Tohono O'odham | 0.0 /100 | #336 | Tragic $45,248 |
| Pueblo | 0.0 /100 | #337 | Tragic $45,018 |
| Chickasaw | 0.0 /100 | #338 | Tragic $44,763 |
| Kiowa | 0.0 /100 | #339 | Tragic $44,733 |
| Blacks/African Americans | 0.0 /100 | #340 | Tragic $44,381 |
| Houma | 0.0 /100 | #341 | Tragic $44,356 |
| Arapaho | 0.0 /100 | #342 | Tragic $44,003 |
| Immigrants | Yemen | 0.0 /100 | #343 | Tragic $43,591 |
| Immigrants | Congo | 0.0 /100 | #344 | Tragic $43,266 |
| Navajo | 0.0 /100 | #345 | Tragic $42,380 |
| Puerto Ricans | 0.0 /100 | #346 | Tragic $39,726 |
| Lumbee | 0.0 /100 | #347 | Tragic $34,584 |
Demographics Similar to Northern Europeans by Householder Income Under 25 years
In terms of householder income under 25 years, the demographic groups most similar to Northern Europeans are Croatian ($51,662, a difference of 0.030%), Immigrants from South Africa ($51,705, a difference of 0.050%), Alaskan Athabascan ($51,713, a difference of 0.070%), Immigrants from Latvia ($51,737, a difference of 0.11%), and Malaysian ($51,615, a difference of 0.12%).
| Demographics | Rating | Rank | Householder Income Under 25 years |
| Europeans | 27.6 /100 | #181 | Fair $51,796 |
| Jordanians | 27.6 /100 | #182 | Fair $51,796 |
| Mexican American Indians | 27.0 /100 | #183 | Fair $51,783 |
| Paiute | 25.1 /100 | #184 | Fair $51,743 |
| Immigrants | Latvia | 24.8 /100 | #185 | Fair $51,737 |
| Alaskan Athabascans | 23.8 /100 | #186 | Fair $51,713 |
| Immigrants | South Africa | 23.4 /100 | #187 | Fair $51,705 |
| Northern Europeans | 22.2 /100 | #188 | Fair $51,678 |
| Croatians | 21.6 /100 | #189 | Fair $51,662 |
| Malaysians | 19.7 /100 | #190 | Poor $51,615 |
| Panamanians | 19.5 /100 | #191 | Poor $51,611 |
| West Indians | 18.5 /100 | #192 | Poor $51,583 |
| Immigrants | Eritrea | 18.1 /100 | #193 | Poor $51,574 |
| Guatemalans | 16.4 /100 | #194 | Poor $51,525 |
| Estonians | 16.4 /100 | #195 | Poor $51,523 |