Black/African American vs Nepalese Householder Income Under 25 years
COMPARE
Black/African American
Nepalese
Householder Income Under 25 years
Householder Income Under 25 years Comparison
Blacks/African Americans
Nepalese
$44,381
HOUSEHOLDER INCOME UNDER 25 YEARS
0.0/ 100
METRIC RATING
340th/ 347
METRIC RANK
$54,472
HOUSEHOLDER INCOME UNDER 25 YEARS
99.6/ 100
METRIC RATING
78th/ 347
METRIC RANK
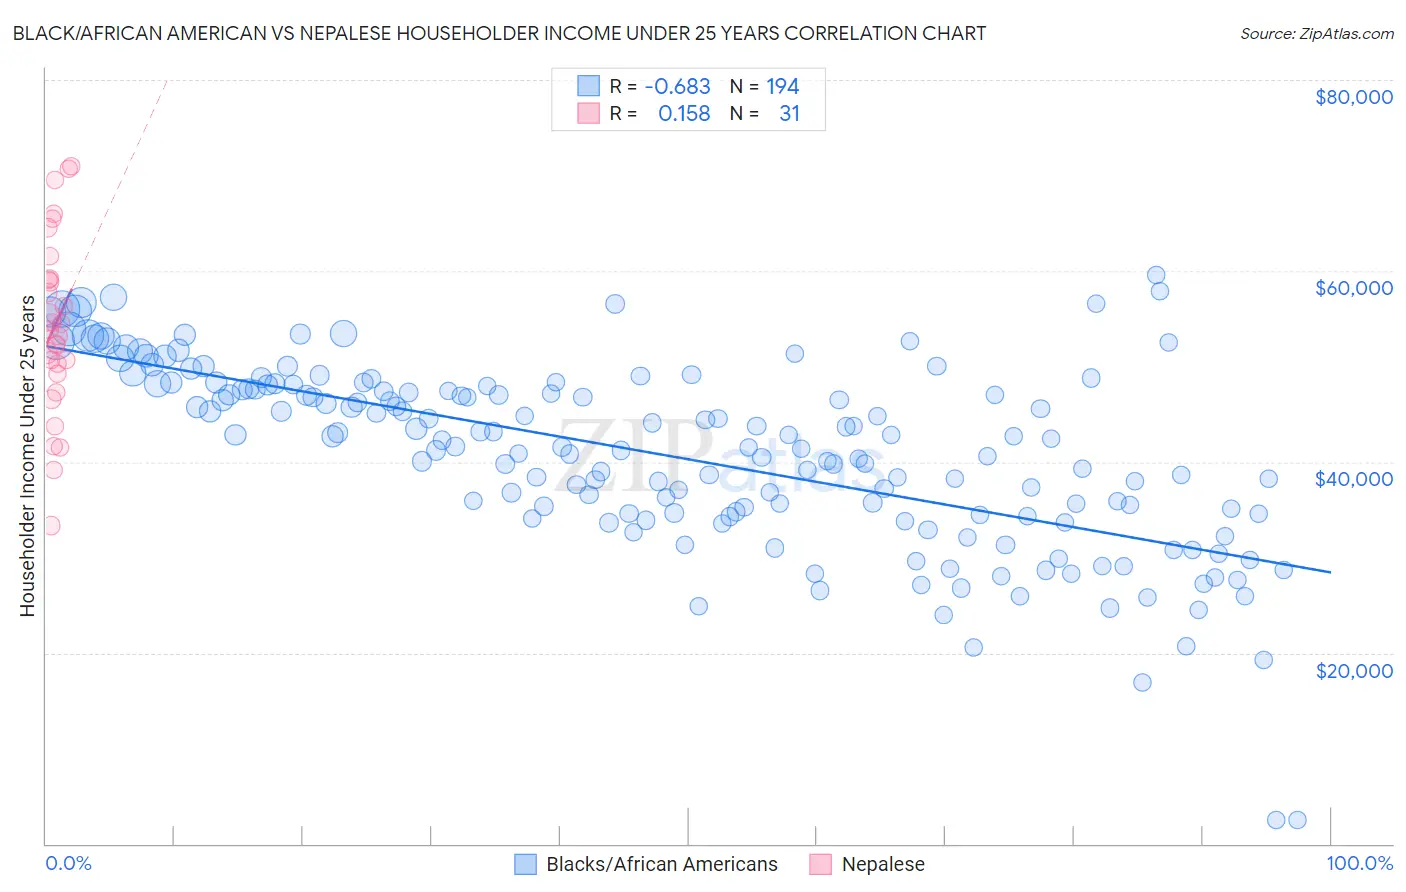
Black/African American vs Nepalese Householder Income Under 25 years Correlation Chart
The statistical analysis conducted on geographies consisting of 438,583,318 people shows a significant negative correlation between the proportion of Blacks/African Americans and household income with householder under the age of 25 in the United States with a correlation coefficient (R) of -0.683 and weighted average of $44,381. Similarly, the statistical analysis conducted on geographies consisting of 22,881,746 people shows a poor positive correlation between the proportion of Nepalese and household income with householder under the age of 25 in the United States with a correlation coefficient (R) of 0.158 and weighted average of $54,472, a difference of 22.7%.
Householder Income Under 25 years Correlation Summary
| Measurement | Black/African American | Nepalese |
| Minimum | $2,499 | $33,325 |
| Maximum | $59,638 | $70,914 |
| Range | $57,139 | $37,589 |
| Mean | $40,625 | $54,229 |
| Median | $41,554 | $53,846 |
| Interquartile 25% (IQ1) | $34,429 | $49,219 |
| Interquartile 75% (IQ3) | $47,684 | $59,177 |
| Interquartile Range (IQR) | $13,255 | $9,958 |
| Standard Deviation (Sample) | $9,747 | $9,280 |
| Standard Deviation (Population) | $9,722 | $9,129 |
Similar Demographics by Householder Income Under 25 years
Demographics Similar to Blacks/African Americans by Householder Income Under 25 years
In terms of householder income under 25 years, the demographic groups most similar to Blacks/African Americans are Houma ($44,356, a difference of 0.060%), Kiowa ($44,733, a difference of 0.79%), Chickasaw ($44,763, a difference of 0.86%), Arapaho ($44,003, a difference of 0.86%), and Pueblo ($45,018, a difference of 1.4%).
| Demographics | Rating | Rank | Householder Income Under 25 years |
| Creek | 0.0 /100 | #333 | Tragic $45,371 |
| Cajuns | 0.0 /100 | #334 | Tragic $45,338 |
| Cheyenne | 0.0 /100 | #335 | Tragic $45,275 |
| Tohono O'odham | 0.0 /100 | #336 | Tragic $45,248 |
| Pueblo | 0.0 /100 | #337 | Tragic $45,018 |
| Chickasaw | 0.0 /100 | #338 | Tragic $44,763 |
| Kiowa | 0.0 /100 | #339 | Tragic $44,733 |
| Blacks/African Americans | 0.0 /100 | #340 | Tragic $44,381 |
| Houma | 0.0 /100 | #341 | Tragic $44,356 |
| Arapaho | 0.0 /100 | #342 | Tragic $44,003 |
| Immigrants | Yemen | 0.0 /100 | #343 | Tragic $43,591 |
| Immigrants | Congo | 0.0 /100 | #344 | Tragic $43,266 |
| Navajo | 0.0 /100 | #345 | Tragic $42,380 |
| Puerto Ricans | 0.0 /100 | #346 | Tragic $39,726 |
| Lumbee | 0.0 /100 | #347 | Tragic $34,584 |
Demographics Similar to Nepalese by Householder Income Under 25 years
In terms of householder income under 25 years, the demographic groups most similar to Nepalese are Immigrants from Southern Europe ($54,484, a difference of 0.020%), Immigrants from Brazil ($54,487, a difference of 0.030%), Immigrants from Italy ($54,449, a difference of 0.040%), Egyptian ($54,444, a difference of 0.050%), and Portuguese ($54,436, a difference of 0.060%).
| Demographics | Rating | Rank | Householder Income Under 25 years |
| Immigrants | Morocco | 99.7 /100 | #71 | Exceptional $54,593 |
| Immigrants | Northern Europe | 99.7 /100 | #72 | Exceptional $54,571 |
| Macedonians | 99.7 /100 | #73 | Exceptional $54,563 |
| Immigrants | Grenada | 99.7 /100 | #74 | Exceptional $54,538 |
| Immigrants | Sri Lanka | 99.7 /100 | #75 | Exceptional $54,512 |
| Immigrants | Brazil | 99.6 /100 | #76 | Exceptional $54,487 |
| Immigrants | Southern Europe | 99.6 /100 | #77 | Exceptional $54,484 |
| Nepalese | 99.6 /100 | #78 | Exceptional $54,472 |
| Immigrants | Italy | 99.6 /100 | #79 | Exceptional $54,449 |
| Egyptians | 99.6 /100 | #80 | Exceptional $54,444 |
| Portuguese | 99.6 /100 | #81 | Exceptional $54,436 |
| Russians | 99.5 /100 | #82 | Exceptional $54,389 |
| Laotians | 99.5 /100 | #83 | Exceptional $54,369 |
| Bulgarians | 99.5 /100 | #84 | Exceptional $54,352 |
| Immigrants | Czechoslovakia | 99.5 /100 | #85 | Exceptional $54,352 |