Black/African American vs Immigrants from Saudi Arabia Householder Income Under 25 years
COMPARE
Black/African American
Immigrants from Saudi Arabia
Householder Income Under 25 years
Householder Income Under 25 years Comparison
Blacks/African Americans
Immigrants from Saudi Arabia
$44,381
HOUSEHOLDER INCOME UNDER 25 YEARS
0.0/ 100
METRIC RATING
340th/ 347
METRIC RANK
$46,187
HOUSEHOLDER INCOME UNDER 25 YEARS
0.0/ 100
METRIC RATING
323rd/ 347
METRIC RANK
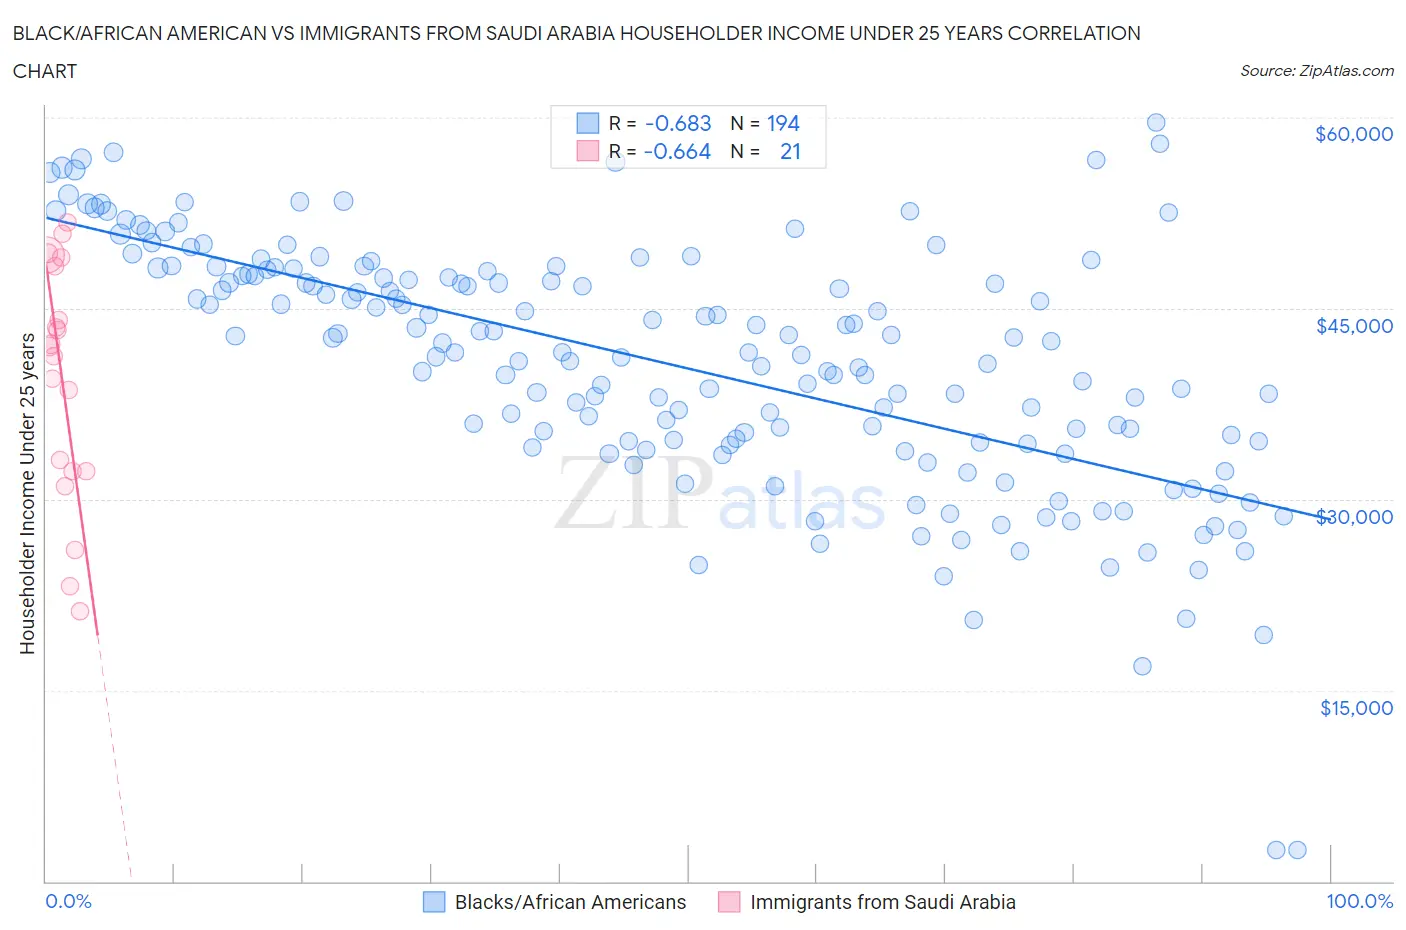
Black/African American vs Immigrants from Saudi Arabia Householder Income Under 25 years Correlation Chart
The statistical analysis conducted on geographies consisting of 438,583,318 people shows a significant negative correlation between the proportion of Blacks/African Americans and household income with householder under the age of 25 in the United States with a correlation coefficient (R) of -0.683 and weighted average of $44,381. Similarly, the statistical analysis conducted on geographies consisting of 152,509,981 people shows a significant negative correlation between the proportion of Immigrants from Saudi Arabia and household income with householder under the age of 25 in the United States with a correlation coefficient (R) of -0.664 and weighted average of $46,187, a difference of 4.1%.
Householder Income Under 25 years Correlation Summary
| Measurement | Black/African American | Immigrants from Saudi Arabia |
| Minimum | $2,499 | $21,200 |
| Maximum | $59,638 | $51,786 |
| Range | $57,139 | $30,586 |
| Mean | $40,625 | $39,611 |
| Median | $41,554 | $42,009 |
| Interquartile 25% (IQ1) | $34,429 | $32,174 |
| Interquartile 75% (IQ3) | $47,684 | $48,671 |
| Interquartile Range (IQR) | $13,255 | $16,497 |
| Standard Deviation (Sample) | $9,747 | $9,248 |
| Standard Deviation (Population) | $9,722 | $9,026 |
Demographics Similar to Blacks/African Americans and Immigrants from Saudi Arabia by Householder Income Under 25 years
In terms of householder income under 25 years, the demographic groups most similar to Blacks/African Americans are Houma ($44,356, a difference of 0.060%), Kiowa ($44,733, a difference of 0.79%), Chickasaw ($44,763, a difference of 0.86%), Pueblo ($45,018, a difference of 1.4%), and Tohono O'odham ($45,248, a difference of 1.9%). Similarly, the demographic groups most similar to Immigrants from Saudi Arabia are Sioux ($46,417, a difference of 0.50%), Potawatomi ($46,462, a difference of 0.60%), Dutch West Indian ($45,816, a difference of 0.81%), Immigrants from Bahamas ($45,793, a difference of 0.86%), and Osage ($45,764, a difference of 0.92%).
| Demographics | Rating | Rank | Householder Income Under 25 years |
| Potawatomi | 0.0 /100 | #321 | Tragic $46,462 |
| Sioux | 0.0 /100 | #322 | Tragic $46,417 |
| Immigrants | Saudi Arabia | 0.0 /100 | #323 | Tragic $46,187 |
| Dutch West Indians | 0.0 /100 | #324 | Tragic $45,816 |
| Immigrants | Bahamas | 0.0 /100 | #325 | Tragic $45,793 |
| Osage | 0.0 /100 | #326 | Tragic $45,764 |
| Bahamians | 0.0 /100 | #327 | Tragic $45,743 |
| German Russians | 0.0 /100 | #328 | Tragic $45,673 |
| Seminole | 0.0 /100 | #329 | Tragic $45,649 |
| Indonesians | 0.0 /100 | #330 | Tragic $45,566 |
| Immigrants | Zaire | 0.0 /100 | #331 | Tragic $45,529 |
| Choctaw | 0.0 /100 | #332 | Tragic $45,450 |
| Creek | 0.0 /100 | #333 | Tragic $45,371 |
| Cajuns | 0.0 /100 | #334 | Tragic $45,338 |
| Cheyenne | 0.0 /100 | #335 | Tragic $45,275 |
| Tohono O'odham | 0.0 /100 | #336 | Tragic $45,248 |
| Pueblo | 0.0 /100 | #337 | Tragic $45,018 |
| Chickasaw | 0.0 /100 | #338 | Tragic $44,763 |
| Kiowa | 0.0 /100 | #339 | Tragic $44,733 |
| Blacks/African Americans | 0.0 /100 | #340 | Tragic $44,381 |
| Houma | 0.0 /100 | #341 | Tragic $44,356 |