Black/African American vs Peruvian Householder Income Under 25 years
COMPARE
Black/African American
Peruvian
Householder Income Under 25 years
Householder Income Under 25 years Comparison
Blacks/African Americans
Peruvians
$44,381
HOUSEHOLDER INCOME UNDER 25 YEARS
0.0/ 100
METRIC RATING
340th/ 347
METRIC RANK
$56,052
HOUSEHOLDER INCOME UNDER 25 YEARS
100.0/ 100
METRIC RATING
32nd/ 347
METRIC RANK
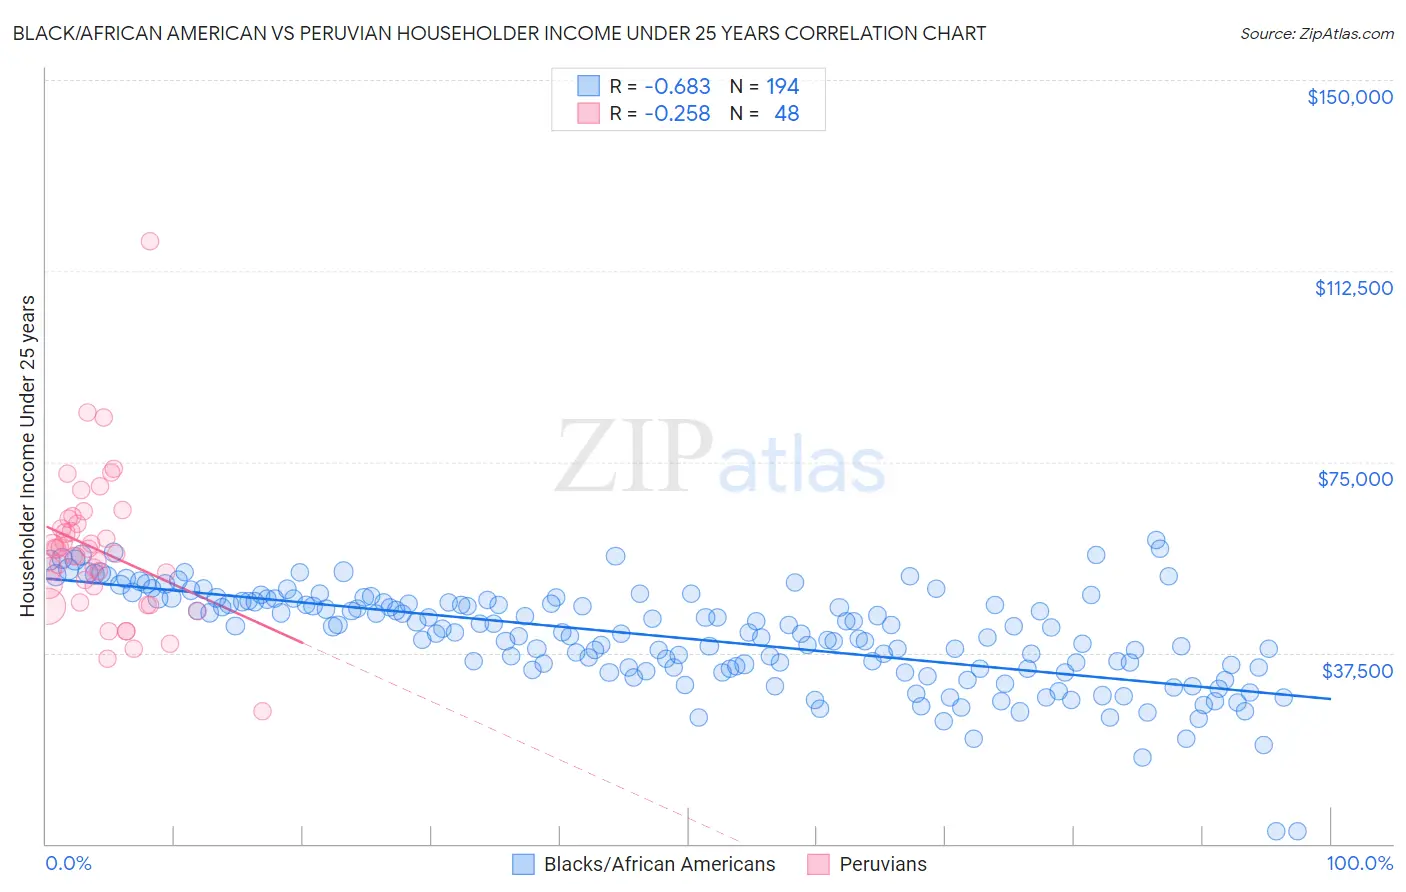
Black/African American vs Peruvian Householder Income Under 25 years Correlation Chart
The statistical analysis conducted on geographies consisting of 438,583,318 people shows a significant negative correlation between the proportion of Blacks/African Americans and household income with householder under the age of 25 in the United States with a correlation coefficient (R) of -0.683 and weighted average of $44,381. Similarly, the statistical analysis conducted on geographies consisting of 309,109,247 people shows a weak negative correlation between the proportion of Peruvians and household income with householder under the age of 25 in the United States with a correlation coefficient (R) of -0.258 and weighted average of $56,052, a difference of 26.3%.
Householder Income Under 25 years Correlation Summary
| Measurement | Black/African American | Peruvian |
| Minimum | $2,499 | $25,923 |
| Maximum | $59,638 | $118,438 |
| Range | $57,139 | $92,515 |
| Mean | $40,625 | $57,665 |
| Median | $41,554 | $57,415 |
| Interquartile 25% (IQ1) | $34,429 | $48,987 |
| Interquartile 75% (IQ3) | $47,684 | $63,410 |
| Interquartile Range (IQR) | $13,255 | $14,423 |
| Standard Deviation (Sample) | $9,747 | $14,693 |
| Standard Deviation (Population) | $9,722 | $14,539 |
Similar Demographics by Householder Income Under 25 years
Demographics Similar to Blacks/African Americans by Householder Income Under 25 years
In terms of householder income under 25 years, the demographic groups most similar to Blacks/African Americans are Houma ($44,356, a difference of 0.060%), Kiowa ($44,733, a difference of 0.79%), Chickasaw ($44,763, a difference of 0.86%), Arapaho ($44,003, a difference of 0.86%), and Pueblo ($45,018, a difference of 1.4%).
| Demographics | Rating | Rank | Householder Income Under 25 years |
| Creek | 0.0 /100 | #333 | Tragic $45,371 |
| Cajuns | 0.0 /100 | #334 | Tragic $45,338 |
| Cheyenne | 0.0 /100 | #335 | Tragic $45,275 |
| Tohono O'odham | 0.0 /100 | #336 | Tragic $45,248 |
| Pueblo | 0.0 /100 | #337 | Tragic $45,018 |
| Chickasaw | 0.0 /100 | #338 | Tragic $44,763 |
| Kiowa | 0.0 /100 | #339 | Tragic $44,733 |
| Blacks/African Americans | 0.0 /100 | #340 | Tragic $44,381 |
| Houma | 0.0 /100 | #341 | Tragic $44,356 |
| Arapaho | 0.0 /100 | #342 | Tragic $44,003 |
| Immigrants | Yemen | 0.0 /100 | #343 | Tragic $43,591 |
| Immigrants | Congo | 0.0 /100 | #344 | Tragic $43,266 |
| Navajo | 0.0 /100 | #345 | Tragic $42,380 |
| Puerto Ricans | 0.0 /100 | #346 | Tragic $39,726 |
| Lumbee | 0.0 /100 | #347 | Tragic $34,584 |
Demographics Similar to Peruvians by Householder Income Under 25 years
In terms of householder income under 25 years, the demographic groups most similar to Peruvians are Vietnamese ($56,127, a difference of 0.13%), Immigrants from Moldova ($56,168, a difference of 0.21%), Inupiat ($55,935, a difference of 0.21%), Immigrants from Japan ($55,932, a difference of 0.21%), and Tlingit-Haida ($55,914, a difference of 0.25%).
| Demographics | Rating | Rank | Householder Income Under 25 years |
| Immigrants | Pakistan | 100.0 /100 | #25 | Exceptional $56,789 |
| Immigrants | Australia | 100.0 /100 | #26 | Exceptional $56,660 |
| Immigrants | North Macedonia | 100.0 /100 | #27 | Exceptional $56,503 |
| Immigrants | Peru | 100.0 /100 | #28 | Exceptional $56,384 |
| Immigrants | Asia | 100.0 /100 | #29 | Exceptional $56,379 |
| Immigrants | Moldova | 100.0 /100 | #30 | Exceptional $56,168 |
| Vietnamese | 100.0 /100 | #31 | Exceptional $56,127 |
| Peruvians | 100.0 /100 | #32 | Exceptional $56,052 |
| Inupiat | 100.0 /100 | #33 | Exceptional $55,935 |
| Immigrants | Japan | 100.0 /100 | #34 | Exceptional $55,932 |
| Tlingit-Haida | 100.0 /100 | #35 | Exceptional $55,914 |
| Immigrants | Israel | 100.0 /100 | #36 | Exceptional $55,913 |
| Immigrants | Russia | 100.0 /100 | #37 | Exceptional $55,891 |
| Immigrants | Iran | 100.0 /100 | #38 | Exceptional $55,880 |
| Immigrants | Belarus | 100.0 /100 | #39 | Exceptional $55,743 |