Immigrants from South America vs Northern European Householder Income Under 25 years
COMPARE
Immigrants from South America
Northern European
Householder Income Under 25 years
Householder Income Under 25 years Comparison
Immigrants from South America
Northern Europeans
$54,268
HOUSEHOLDER INCOME UNDER 25 YEARS
99.4/ 100
METRIC RATING
89th/ 347
METRIC RANK
$51,678
HOUSEHOLDER INCOME UNDER 25 YEARS
22.2/ 100
METRIC RATING
188th/ 347
METRIC RANK
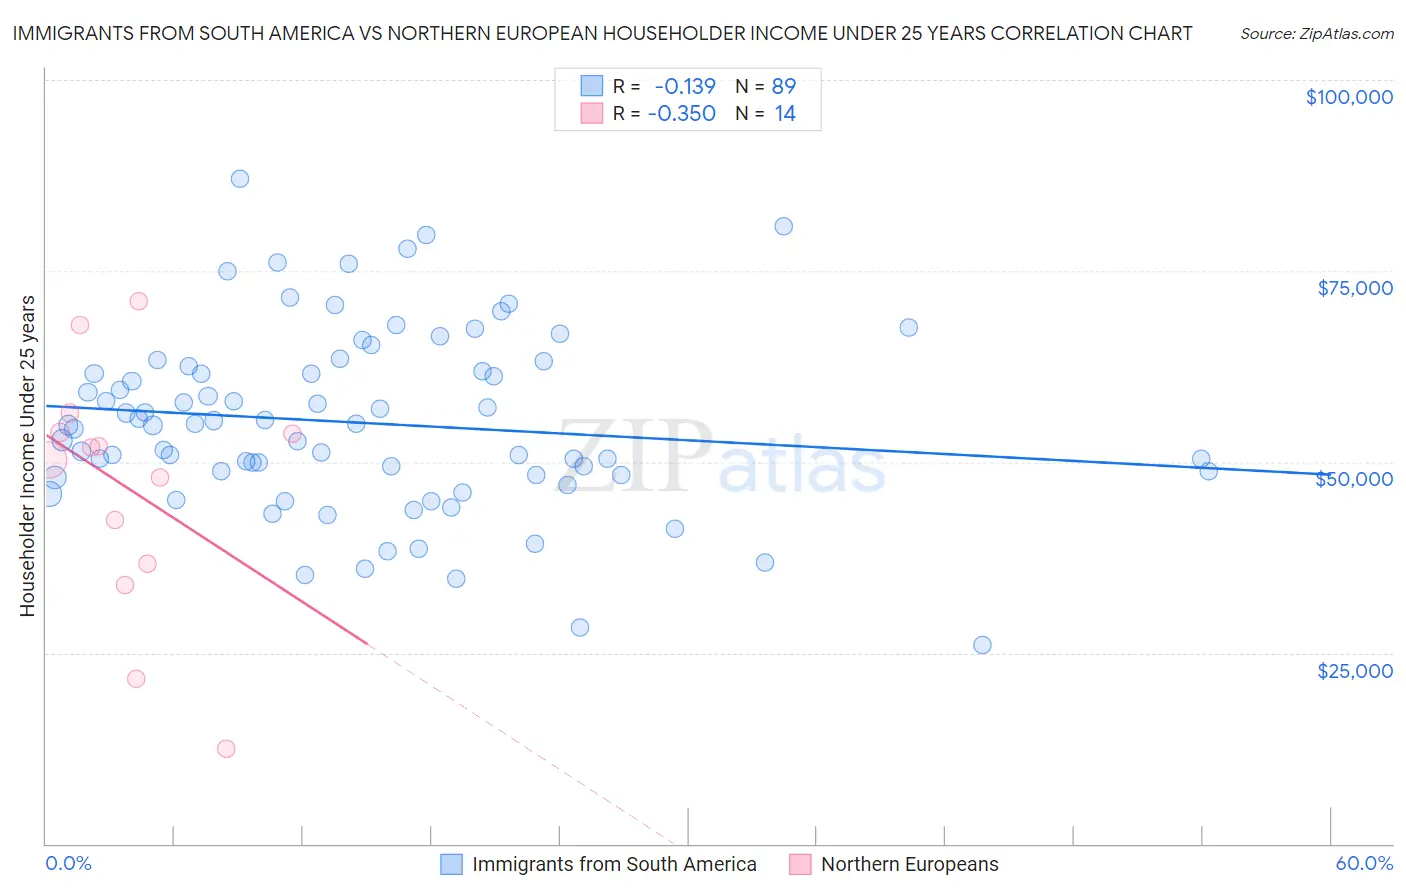
Immigrants from South America vs Northern European Householder Income Under 25 years Correlation Chart
The statistical analysis conducted on geographies consisting of 396,063,428 people shows a poor negative correlation between the proportion of Immigrants from South America and household income with householder under the age of 25 in the United States with a correlation coefficient (R) of -0.139 and weighted average of $54,268. Similarly, the statistical analysis conducted on geographies consisting of 340,537,384 people shows a mild negative correlation between the proportion of Northern Europeans and household income with householder under the age of 25 in the United States with a correlation coefficient (R) of -0.350 and weighted average of $51,678, a difference of 5.0%.
Householder Income Under 25 years Correlation Summary
| Measurement | Immigrants from South America | Northern European |
| Minimum | $26,011 | $12,500 |
| Maximum | $87,060 | $71,017 |
| Range | $61,049 | $58,517 |
| Mean | $55,119 | $46,566 |
| Median | $54,815 | $51,044 |
| Interquartile 25% (IQ1) | $48,291 | $36,723 |
| Interquartile 75% (IQ3) | $62,210 | $53,780 |
| Interquartile Range (IQR) | $13,919 | $17,057 |
| Standard Deviation (Sample) | $11,829 | $16,138 |
| Standard Deviation (Population) | $11,762 | $15,551 |
Similar Demographics by Householder Income Under 25 years
Demographics Similar to Immigrants from South America by Householder Income Under 25 years
In terms of householder income under 25 years, the demographic groups most similar to Immigrants from South America are Turkish ($54,266, a difference of 0.0%), Immigrants from Egypt ($54,239, a difference of 0.050%), Immigrants from St. Vincent and the Grenadines ($54,230, a difference of 0.070%), Yakama ($54,321, a difference of 0.10%), and Immigrants from Argentina ($54,209, a difference of 0.11%).
| Demographics | Rating | Rank | Householder Income Under 25 years |
| Russians | 99.5 /100 | #82 | Exceptional $54,389 |
| Laotians | 99.5 /100 | #83 | Exceptional $54,369 |
| Bulgarians | 99.5 /100 | #84 | Exceptional $54,352 |
| Immigrants | Czechoslovakia | 99.5 /100 | #85 | Exceptional $54,352 |
| Immigrants | Croatia | 99.5 /100 | #86 | Exceptional $54,343 |
| Brazilians | 99.5 /100 | #87 | Exceptional $54,335 |
| Yakama | 99.5 /100 | #88 | Exceptional $54,321 |
| Immigrants | South America | 99.4 /100 | #89 | Exceptional $54,268 |
| Turks | 99.4 /100 | #90 | Exceptional $54,266 |
| Immigrants | Egypt | 99.3 /100 | #91 | Exceptional $54,239 |
| Immigrants | St. Vincent and the Grenadines | 99.3 /100 | #92 | Exceptional $54,230 |
| Immigrants | Argentina | 99.3 /100 | #93 | Exceptional $54,209 |
| Immigrants | Sierra Leone | 99.3 /100 | #94 | Exceptional $54,190 |
| Immigrants | Malaysia | 99.2 /100 | #95 | Exceptional $54,179 |
| Argentineans | 99.2 /100 | #96 | Exceptional $54,154 |
Demographics Similar to Northern Europeans by Householder Income Under 25 years
In terms of householder income under 25 years, the demographic groups most similar to Northern Europeans are Croatian ($51,662, a difference of 0.030%), Immigrants from South Africa ($51,705, a difference of 0.050%), Alaskan Athabascan ($51,713, a difference of 0.070%), Immigrants from Latvia ($51,737, a difference of 0.11%), and Malaysian ($51,615, a difference of 0.12%).
| Demographics | Rating | Rank | Householder Income Under 25 years |
| Europeans | 27.6 /100 | #181 | Fair $51,796 |
| Jordanians | 27.6 /100 | #182 | Fair $51,796 |
| Mexican American Indians | 27.0 /100 | #183 | Fair $51,783 |
| Paiute | 25.1 /100 | #184 | Fair $51,743 |
| Immigrants | Latvia | 24.8 /100 | #185 | Fair $51,737 |
| Alaskan Athabascans | 23.8 /100 | #186 | Fair $51,713 |
| Immigrants | South Africa | 23.4 /100 | #187 | Fair $51,705 |
| Northern Europeans | 22.2 /100 | #188 | Fair $51,678 |
| Croatians | 21.6 /100 | #189 | Fair $51,662 |
| Malaysians | 19.7 /100 | #190 | Poor $51,615 |
| Panamanians | 19.5 /100 | #191 | Poor $51,611 |
| West Indians | 18.5 /100 | #192 | Poor $51,583 |
| Immigrants | Eritrea | 18.1 /100 | #193 | Poor $51,574 |
| Guatemalans | 16.4 /100 | #194 | Poor $51,525 |
| Estonians | 16.4 /100 | #195 | Poor $51,523 |