Black/African American vs Irish Householder Income Under 25 years
COMPARE
Black/African American
Irish
Householder Income Under 25 years
Householder Income Under 25 years Comparison
Blacks/African Americans
Irish
$44,381
HOUSEHOLDER INCOME UNDER 25 YEARS
0.0/ 100
METRIC RATING
340th/ 347
METRIC RANK
$51,317
HOUSEHOLDER INCOME UNDER 25 YEARS
10.6/ 100
METRIC RATING
211th/ 347
METRIC RANK
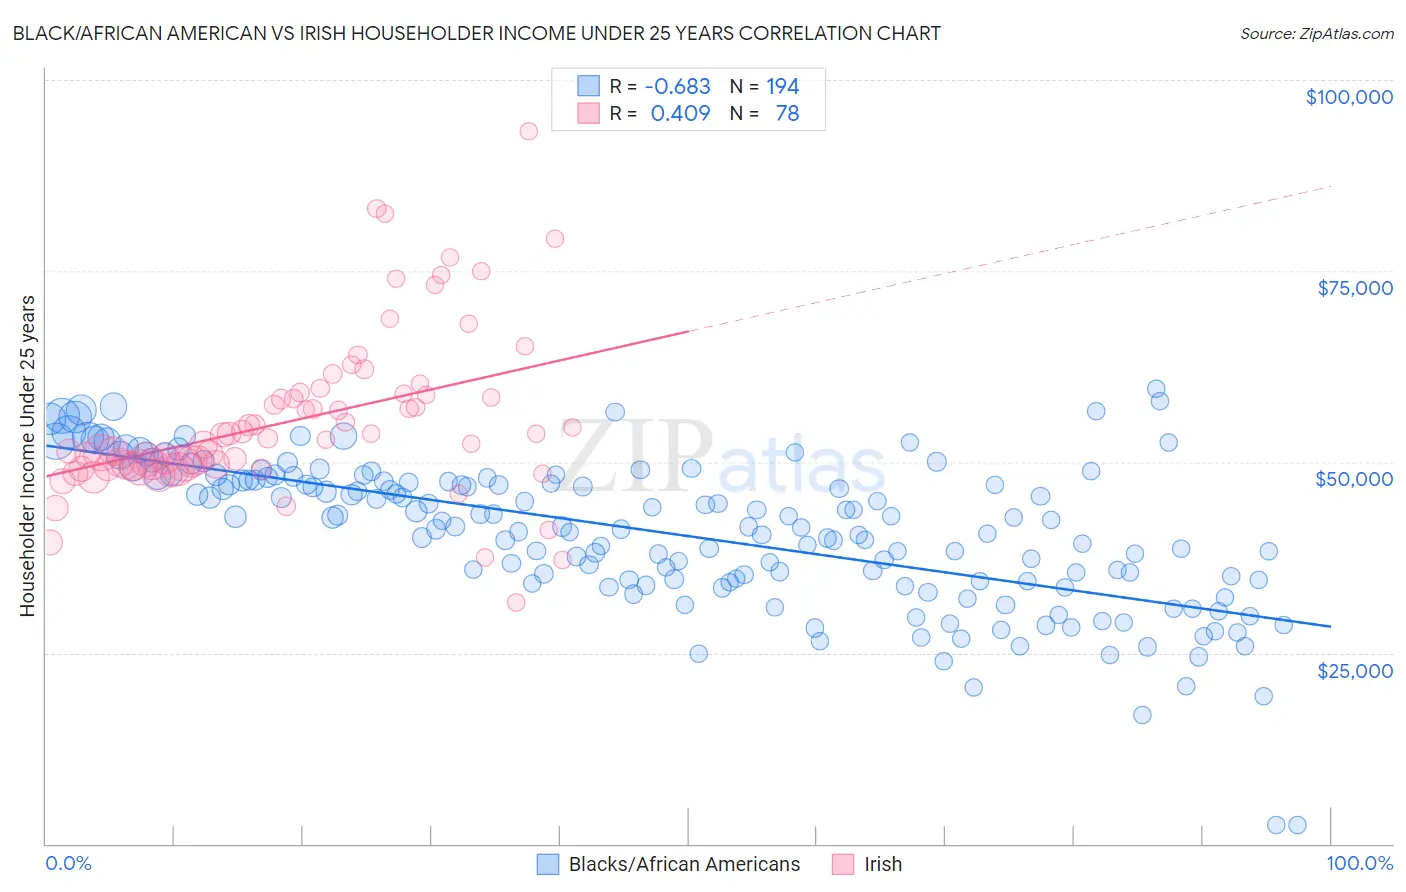
Black/African American vs Irish Householder Income Under 25 years Correlation Chart
The statistical analysis conducted on geographies consisting of 438,583,318 people shows a significant negative correlation between the proportion of Blacks/African Americans and household income with householder under the age of 25 in the United States with a correlation coefficient (R) of -0.683 and weighted average of $44,381. Similarly, the statistical analysis conducted on geographies consisting of 440,822,070 people shows a moderate positive correlation between the proportion of Irish and household income with householder under the age of 25 in the United States with a correlation coefficient (R) of 0.409 and weighted average of $51,317, a difference of 15.6%.
Householder Income Under 25 years Correlation Summary
| Measurement | Black/African American | Irish |
| Minimum | $2,499 | $31,667 |
| Maximum | $59,638 | $93,226 |
| Range | $57,139 | $61,559 |
| Mean | $40,625 | $55,607 |
| Median | $41,554 | $53,275 |
| Interquartile 25% (IQ1) | $34,429 | $49,439 |
| Interquartile 75% (IQ3) | $47,684 | $58,969 |
| Interquartile Range (IQR) | $13,255 | $9,530 |
| Standard Deviation (Sample) | $9,747 | $10,889 |
| Standard Deviation (Population) | $9,722 | $10,819 |
Similar Demographics by Householder Income Under 25 years
Demographics Similar to Blacks/African Americans by Householder Income Under 25 years
In terms of householder income under 25 years, the demographic groups most similar to Blacks/African Americans are Houma ($44,356, a difference of 0.060%), Kiowa ($44,733, a difference of 0.79%), Chickasaw ($44,763, a difference of 0.86%), Arapaho ($44,003, a difference of 0.86%), and Pueblo ($45,018, a difference of 1.4%).
| Demographics | Rating | Rank | Householder Income Under 25 years |
| Creek | 0.0 /100 | #333 | Tragic $45,371 |
| Cajuns | 0.0 /100 | #334 | Tragic $45,338 |
| Cheyenne | 0.0 /100 | #335 | Tragic $45,275 |
| Tohono O'odham | 0.0 /100 | #336 | Tragic $45,248 |
| Pueblo | 0.0 /100 | #337 | Tragic $45,018 |
| Chickasaw | 0.0 /100 | #338 | Tragic $44,763 |
| Kiowa | 0.0 /100 | #339 | Tragic $44,733 |
| Blacks/African Americans | 0.0 /100 | #340 | Tragic $44,381 |
| Houma | 0.0 /100 | #341 | Tragic $44,356 |
| Arapaho | 0.0 /100 | #342 | Tragic $44,003 |
| Immigrants | Yemen | 0.0 /100 | #343 | Tragic $43,591 |
| Immigrants | Congo | 0.0 /100 | #344 | Tragic $43,266 |
| Navajo | 0.0 /100 | #345 | Tragic $42,380 |
| Puerto Ricans | 0.0 /100 | #346 | Tragic $39,726 |
| Lumbee | 0.0 /100 | #347 | Tragic $34,584 |
Demographics Similar to Irish by Householder Income Under 25 years
In terms of householder income under 25 years, the demographic groups most similar to Irish are Immigrants from Ghana ($51,333, a difference of 0.030%), Syrian ($51,353, a difference of 0.070%), Immigrants from Panama ($51,278, a difference of 0.080%), Immigrants from Jordan ($51,370, a difference of 0.10%), and Dutch ($51,265, a difference of 0.10%).
| Demographics | Rating | Rank | Householder Income Under 25 years |
| Czechs | 13.2 /100 | #204 | Poor $51,421 |
| Cape Verdeans | 12.3 /100 | #205 | Poor $51,387 |
| Immigrants | Latin America | 12.3 /100 | #206 | Poor $51,387 |
| South Africans | 12.2 /100 | #207 | Poor $51,383 |
| Immigrants | Jordan | 11.9 /100 | #208 | Poor $51,370 |
| Syrians | 11.4 /100 | #209 | Poor $51,353 |
| Immigrants | Ghana | 10.9 /100 | #210 | Poor $51,333 |
| Irish | 10.6 /100 | #211 | Poor $51,317 |
| Immigrants | Panama | 9.7 /100 | #212 | Tragic $51,278 |
| Dutch | 9.4 /100 | #213 | Tragic $51,265 |
| Zimbabweans | 9.3 /100 | #214 | Tragic $51,259 |
| Icelanders | 9.1 /100 | #215 | Tragic $51,247 |
| French | 8.7 /100 | #216 | Tragic $51,230 |
| Czechoslovakians | 8.6 /100 | #217 | Tragic $51,224 |
| Immigrants | Belize | 8.6 /100 | #218 | Tragic $51,223 |