Finnish vs Northern European Householder Income Under 25 years
COMPARE
Finnish
Northern European
Householder Income Under 25 years
Householder Income Under 25 years Comparison
Finns
Northern Europeans
$51,827
HOUSEHOLDER INCOME UNDER 25 YEARS
29.2/ 100
METRIC RATING
178th/ 347
METRIC RANK
$51,678
HOUSEHOLDER INCOME UNDER 25 YEARS
22.2/ 100
METRIC RATING
188th/ 347
METRIC RANK
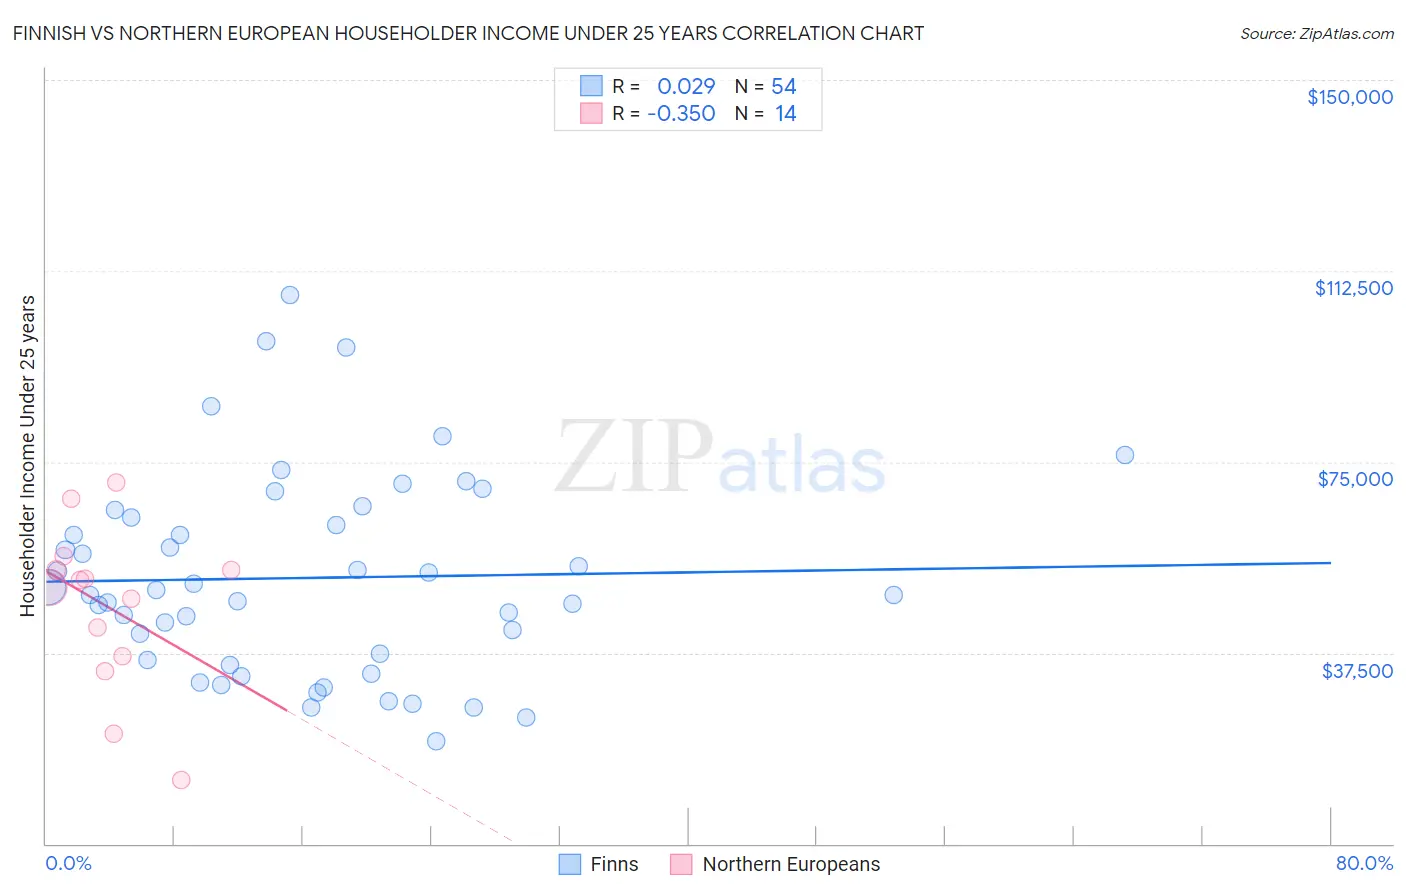
Finnish vs Northern European Householder Income Under 25 years Correlation Chart
The statistical analysis conducted on geographies consisting of 338,519,721 people shows no correlation between the proportion of Finns and household income with householder under the age of 25 in the United States with a correlation coefficient (R) of 0.029 and weighted average of $51,827. Similarly, the statistical analysis conducted on geographies consisting of 340,537,384 people shows a mild negative correlation between the proportion of Northern Europeans and household income with householder under the age of 25 in the United States with a correlation coefficient (R) of -0.350 and weighted average of $51,678, a difference of 0.29%.
Householder Income Under 25 years Correlation Summary
| Measurement | Finnish | Northern European |
| Minimum | $20,019 | $12,500 |
| Maximum | $107,709 | $71,017 |
| Range | $87,690 | $58,517 |
| Mean | $52,217 | $46,566 |
| Median | $49,349 | $51,044 |
| Interquartile 25% (IQ1) | $36,122 | $36,723 |
| Interquartile 75% (IQ3) | $63,954 | $53,780 |
| Interquartile Range (IQR) | $27,832 | $17,057 |
| Standard Deviation (Sample) | $19,708 | $16,138 |
| Standard Deviation (Population) | $19,525 | $15,551 |
Demographics Similar to Finns and Northern Europeans by Householder Income Under 25 years
In terms of householder income under 25 years, the demographic groups most similar to Finns are Basque ($51,818, a difference of 0.020%), Immigrants from England ($51,817, a difference of 0.020%), British West Indian ($51,844, a difference of 0.030%), European ($51,796, a difference of 0.060%), and Jordanian ($51,796, a difference of 0.060%). Similarly, the demographic groups most similar to Northern Europeans are Croatian ($51,662, a difference of 0.030%), Immigrants from South Africa ($51,705, a difference of 0.050%), Alaskan Athabascan ($51,713, a difference of 0.070%), Immigrants from Latvia ($51,737, a difference of 0.11%), and Malaysian ($51,615, a difference of 0.12%).
| Demographics | Rating | Rank | Householder Income Under 25 years |
| Barbadians | 50.8 /100 | #173 | Average $52,202 |
| Immigrants | Western Asia | 50.0 /100 | #174 | Average $52,190 |
| Immigrants | Zimbabwe | 33.8 /100 | #175 | Fair $51,914 |
| Austrians | 32.9 /100 | #176 | Fair $51,898 |
| British West Indians | 30.0 /100 | #177 | Fair $51,844 |
| Finns | 29.2 /100 | #178 | Fair $51,827 |
| Basques | 28.7 /100 | #179 | Fair $51,818 |
| Immigrants | England | 28.7 /100 | #180 | Fair $51,817 |
| Europeans | 27.6 /100 | #181 | Fair $51,796 |
| Jordanians | 27.6 /100 | #182 | Fair $51,796 |
| Mexican American Indians | 27.0 /100 | #183 | Fair $51,783 |
| Paiute | 25.1 /100 | #184 | Fair $51,743 |
| Immigrants | Latvia | 24.8 /100 | #185 | Fair $51,737 |
| Alaskan Athabascans | 23.8 /100 | #186 | Fair $51,713 |
| Immigrants | South Africa | 23.4 /100 | #187 | Fair $51,705 |
| Northern Europeans | 22.2 /100 | #188 | Fair $51,678 |
| Croatians | 21.6 /100 | #189 | Fair $51,662 |
| Malaysians | 19.7 /100 | #190 | Poor $51,615 |
| Panamanians | 19.5 /100 | #191 | Poor $51,611 |
| West Indians | 18.5 /100 | #192 | Poor $51,583 |
| Immigrants | Eritrea | 18.1 /100 | #193 | Poor $51,574 |