Black/African American vs Northern European Median Family Income
COMPARE
Black/African American
Northern European
Median Family Income
Median Family Income Comparison
Blacks/African Americans
Northern Europeans
$81,912
MEDIAN FAMILY INCOME
0.0/ 100
METRIC RATING
328th/ 347
METRIC RANK
$110,635
MEDIAN FAMILY INCOME
98.3/ 100
METRIC RATING
90th/ 347
METRIC RANK
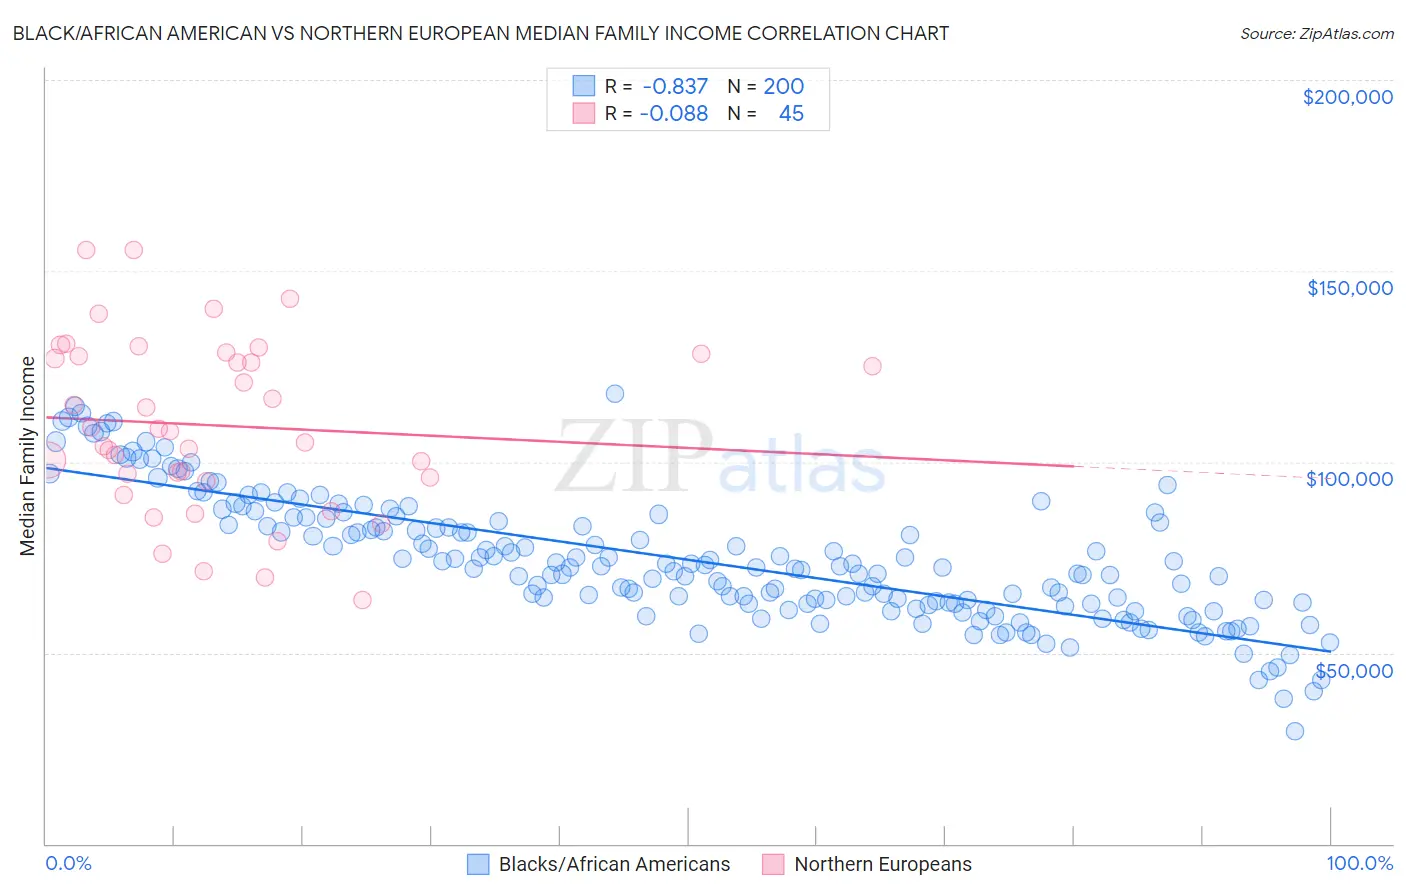
Black/African American vs Northern European Median Family Income Correlation Chart
The statistical analysis conducted on geographies consisting of 564,544,060 people shows a very strong negative correlation between the proportion of Blacks/African Americans and median family income in the United States with a correlation coefficient (R) of -0.837 and weighted average of $81,912. Similarly, the statistical analysis conducted on geographies consisting of 405,831,688 people shows a slight negative correlation between the proportion of Northern Europeans and median family income in the United States with a correlation coefficient (R) of -0.088 and weighted average of $110,635, a difference of 35.1%.
Median Family Income Correlation Summary
| Measurement | Black/African American | Northern European |
| Minimum | $29,315 | $63,831 |
| Maximum | $117,822 | $155,510 |
| Range | $88,507 | $91,679 |
| Mean | $74,336 | $109,529 |
| Median | $72,335 | $108,010 |
| Interquartile 25% (IQ1) | $62,832 | $95,374 |
| Interquartile 75% (IQ3) | $85,289 | $127,951 |
| Interquartile Range (IQR) | $22,457 | $32,577 |
| Standard Deviation (Sample) | $16,637 | $22,485 |
| Standard Deviation (Population) | $16,596 | $22,234 |
Similar Demographics by Median Family Income
Demographics Similar to Blacks/African Americans by Median Family Income
In terms of median family income, the demographic groups most similar to Blacks/African Americans are Dutch West Indian ($81,852, a difference of 0.070%), Arapaho ($82,064, a difference of 0.18%), Immigrants from Congo ($82,216, a difference of 0.37%), Sioux ($82,386, a difference of 0.58%), and Cheyenne ($81,385, a difference of 0.65%).
| Demographics | Rating | Rank | Median Family Income |
| Immigrants | Caribbean | 0.0 /100 | #321 | Tragic $83,319 |
| Dominicans | 0.0 /100 | #322 | Tragic $82,888 |
| Bahamians | 0.0 /100 | #323 | Tragic $82,631 |
| Creek | 0.0 /100 | #324 | Tragic $82,560 |
| Sioux | 0.0 /100 | #325 | Tragic $82,386 |
| Immigrants | Congo | 0.0 /100 | #326 | Tragic $82,216 |
| Arapaho | 0.0 /100 | #327 | Tragic $82,064 |
| Blacks/African Americans | 0.0 /100 | #328 | Tragic $81,912 |
| Dutch West Indians | 0.0 /100 | #329 | Tragic $81,852 |
| Cheyenne | 0.0 /100 | #330 | Tragic $81,385 |
| Immigrants | Dominican Republic | 0.0 /100 | #331 | Tragic $81,233 |
| Natives/Alaskans | 0.0 /100 | #332 | Tragic $80,908 |
| Kiowa | 0.0 /100 | #333 | Tragic $80,885 |
| Menominee | 0.0 /100 | #334 | Tragic $79,563 |
| Yup'ik | 0.0 /100 | #335 | Tragic $79,290 |
Demographics Similar to Northern Europeans by Median Family Income
In terms of median family income, the demographic groups most similar to Northern Europeans are Immigrants from Southern Europe ($110,614, a difference of 0.020%), Immigrants from Argentina ($110,873, a difference of 0.21%), Immigrants from Lebanon ($110,159, a difference of 0.43%), Immigrants from Kazakhstan ($110,137, a difference of 0.45%), and Korean ($110,103, a difference of 0.48%).
| Demographics | Rating | Rank | Median Family Income |
| Immigrants | Egypt | 99.0 /100 | #83 | Exceptional $111,689 |
| Immigrants | Hungary | 98.8 /100 | #84 | Exceptional $111,378 |
| Croatians | 98.8 /100 | #85 | Exceptional $111,370 |
| Ukrainians | 98.8 /100 | #86 | Exceptional $111,368 |
| Austrians | 98.8 /100 | #87 | Exceptional $111,306 |
| Romanians | 98.8 /100 | #88 | Exceptional $111,243 |
| Immigrants | Argentina | 98.5 /100 | #89 | Exceptional $110,873 |
| Northern Europeans | 98.3 /100 | #90 | Exceptional $110,635 |
| Immigrants | Southern Europe | 98.3 /100 | #91 | Exceptional $110,614 |
| Immigrants | Lebanon | 97.9 /100 | #92 | Exceptional $110,159 |
| Immigrants | Kazakhstan | 97.8 /100 | #93 | Exceptional $110,137 |
| Koreans | 97.8 /100 | #94 | Exceptional $110,103 |
| Zimbabweans | 97.7 /100 | #95 | Exceptional $110,011 |
| Immigrants | Moldova | 97.7 /100 | #96 | Exceptional $109,975 |
| Jordanians | 97.5 /100 | #97 | Exceptional $109,865 |