Black/African American vs Belizean Householder Income Under 25 years
COMPARE
Black/African American
Belizean
Householder Income Under 25 years
Householder Income Under 25 years Comparison
Blacks/African Americans
Belizeans
$44,381
HOUSEHOLDER INCOME UNDER 25 YEARS
0.0/ 100
METRIC RATING
340th/ 347
METRIC RANK
$51,094
HOUSEHOLDER INCOME UNDER 25 YEARS
6.4/ 100
METRIC RATING
224th/ 347
METRIC RANK
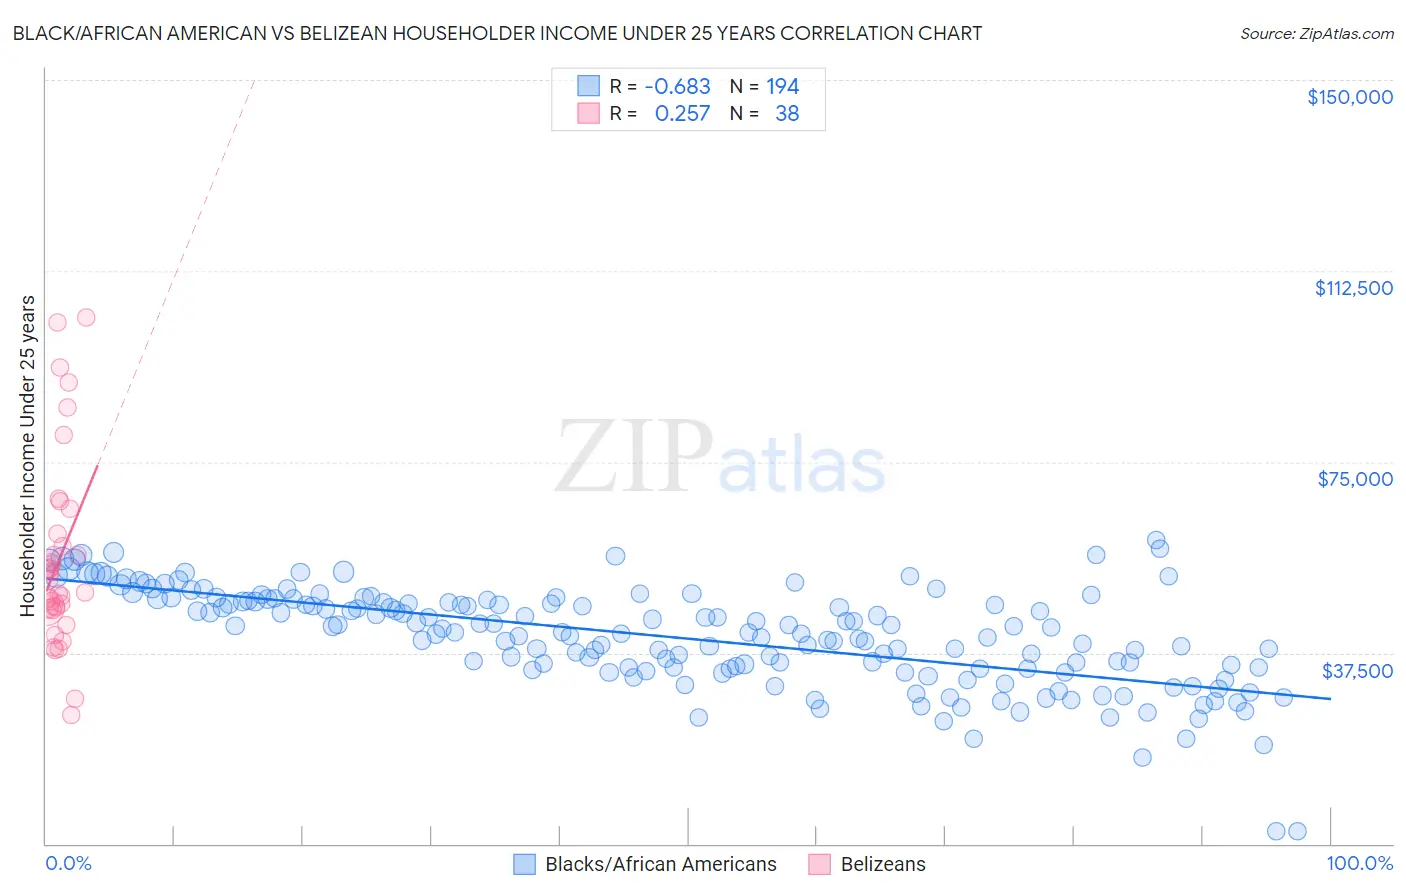
Black/African American vs Belizean Householder Income Under 25 years Correlation Chart
The statistical analysis conducted on geographies consisting of 438,583,318 people shows a significant negative correlation between the proportion of Blacks/African Americans and household income with householder under the age of 25 in the United States with a correlation coefficient (R) of -0.683 and weighted average of $44,381. Similarly, the statistical analysis conducted on geographies consisting of 132,883,097 people shows a weak positive correlation between the proportion of Belizeans and household income with householder under the age of 25 in the United States with a correlation coefficient (R) of 0.257 and weighted average of $51,094, a difference of 15.1%.
Householder Income Under 25 years Correlation Summary
| Measurement | Black/African American | Belizean |
| Minimum | $2,499 | $25,260 |
| Maximum | $59,638 | $103,333 |
| Range | $57,139 | $78,073 |
| Mean | $40,625 | $55,975 |
| Median | $41,554 | $50,853 |
| Interquartile 25% (IQ1) | $34,429 | $46,192 |
| Interquartile 75% (IQ3) | $47,684 | $60,909 |
| Interquartile Range (IQR) | $13,255 | $14,716 |
| Standard Deviation (Sample) | $9,747 | $18,766 |
| Standard Deviation (Population) | $9,722 | $18,517 |
Similar Demographics by Householder Income Under 25 years
Demographics Similar to Blacks/African Americans by Householder Income Under 25 years
In terms of householder income under 25 years, the demographic groups most similar to Blacks/African Americans are Houma ($44,356, a difference of 0.060%), Kiowa ($44,733, a difference of 0.79%), Chickasaw ($44,763, a difference of 0.86%), Arapaho ($44,003, a difference of 0.86%), and Pueblo ($45,018, a difference of 1.4%).
| Demographics | Rating | Rank | Householder Income Under 25 years |
| Creek | 0.0 /100 | #333 | Tragic $45,371 |
| Cajuns | 0.0 /100 | #334 | Tragic $45,338 |
| Cheyenne | 0.0 /100 | #335 | Tragic $45,275 |
| Tohono O'odham | 0.0 /100 | #336 | Tragic $45,248 |
| Pueblo | 0.0 /100 | #337 | Tragic $45,018 |
| Chickasaw | 0.0 /100 | #338 | Tragic $44,763 |
| Kiowa | 0.0 /100 | #339 | Tragic $44,733 |
| Blacks/African Americans | 0.0 /100 | #340 | Tragic $44,381 |
| Houma | 0.0 /100 | #341 | Tragic $44,356 |
| Arapaho | 0.0 /100 | #342 | Tragic $44,003 |
| Immigrants | Yemen | 0.0 /100 | #343 | Tragic $43,591 |
| Immigrants | Congo | 0.0 /100 | #344 | Tragic $43,266 |
| Navajo | 0.0 /100 | #345 | Tragic $42,380 |
| Puerto Ricans | 0.0 /100 | #346 | Tragic $39,726 |
| Lumbee | 0.0 /100 | #347 | Tragic $34,584 |
Demographics Similar to Belizeans by Householder Income Under 25 years
In terms of householder income under 25 years, the demographic groups most similar to Belizeans are Serbian ($51,106, a difference of 0.020%), Spaniard ($51,117, a difference of 0.050%), Immigrants from Jamaica ($51,038, a difference of 0.11%), Immigrants from Eastern Africa ($51,158, a difference of 0.13%), and Yugoslavian ($51,028, a difference of 0.13%).
| Demographics | Rating | Rank | Householder Income Under 25 years |
| Czechoslovakians | 8.6 /100 | #217 | Tragic $51,224 |
| Immigrants | Belize | 8.6 /100 | #218 | Tragic $51,223 |
| Arabs | 8.5 /100 | #219 | Tragic $51,219 |
| Immigrants | Germany | 8.0 /100 | #220 | Tragic $51,190 |
| Immigrants | Eastern Africa | 7.4 /100 | #221 | Tragic $51,158 |
| Spaniards | 6.8 /100 | #222 | Tragic $51,117 |
| Serbians | 6.6 /100 | #223 | Tragic $51,106 |
| Belizeans | 6.4 /100 | #224 | Tragic $51,094 |
| Immigrants | Jamaica | 5.6 /100 | #225 | Tragic $51,038 |
| Yugoslavians | 5.5 /100 | #226 | Tragic $51,028 |
| Immigrants | Central America | 5.4 /100 | #227 | Tragic $51,022 |
| Immigrants | Norway | 5.0 /100 | #228 | Tragic $50,984 |
| Yuman | 4.4 /100 | #229 | Tragic $50,933 |
| Jamaicans | 4.4 /100 | #230 | Tragic $50,929 |
| Ugandans | 4.3 /100 | #231 | Tragic $50,923 |