Alsatian vs Northern European Householder Income Under 25 years
COMPARE
Alsatian
Northern European
Householder Income Under 25 years
Householder Income Under 25 years Comparison
Alsatians
Northern Europeans
$49,267
HOUSEHOLDER INCOME UNDER 25 YEARS
0.1/ 100
METRIC RATING
282nd/ 347
METRIC RANK
$51,678
HOUSEHOLDER INCOME UNDER 25 YEARS
22.2/ 100
METRIC RATING
188th/ 347
METRIC RANK
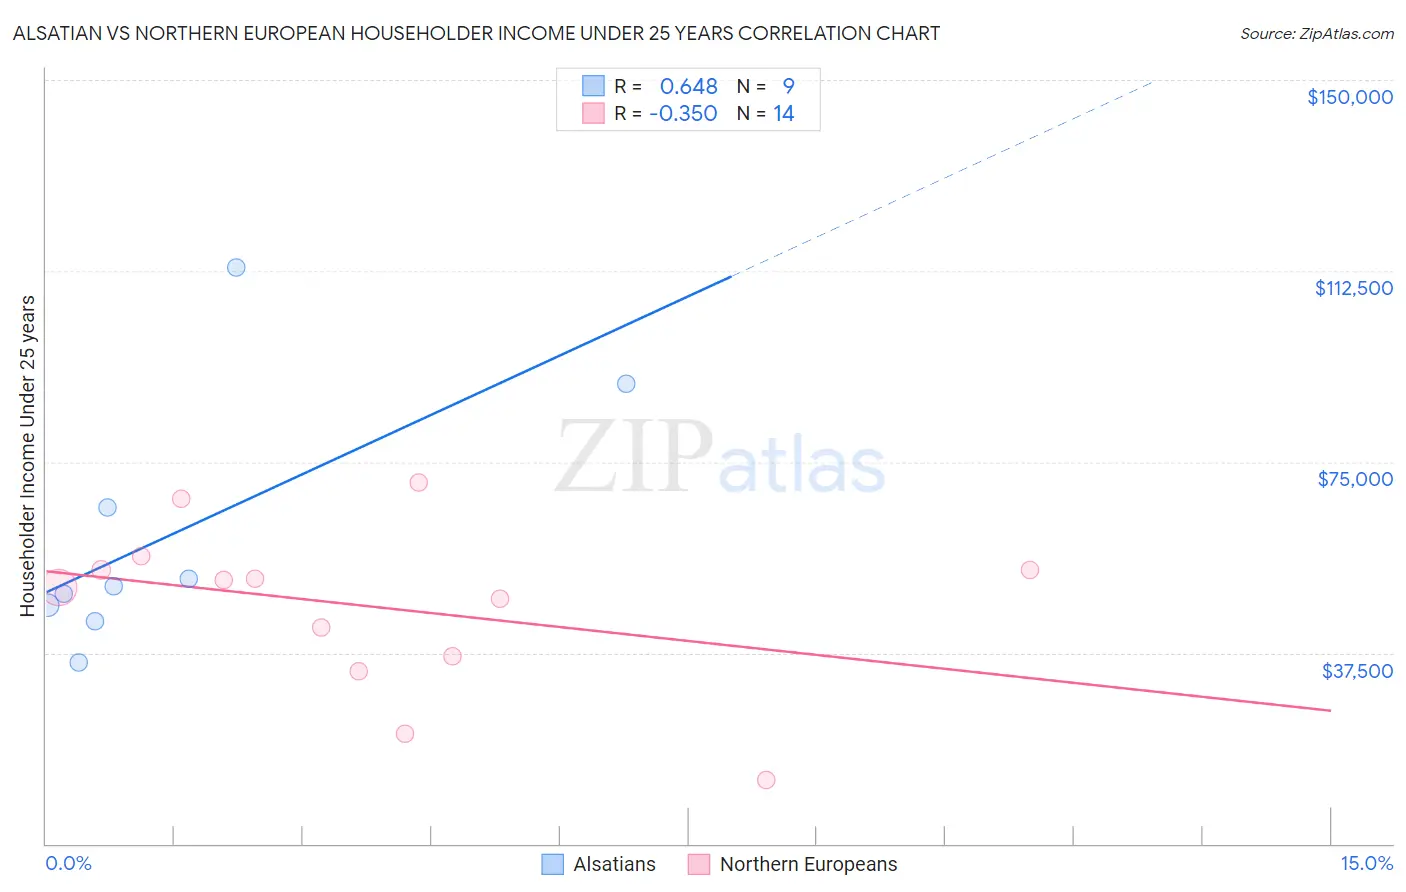
Alsatian vs Northern European Householder Income Under 25 years Correlation Chart
The statistical analysis conducted on geographies consisting of 77,564,981 people shows a significant positive correlation between the proportion of Alsatians and household income with householder under the age of 25 in the United States with a correlation coefficient (R) of 0.648 and weighted average of $49,267. Similarly, the statistical analysis conducted on geographies consisting of 340,537,384 people shows a mild negative correlation between the proportion of Northern Europeans and household income with householder under the age of 25 in the United States with a correlation coefficient (R) of -0.350 and weighted average of $51,678, a difference of 4.9%.
Householder Income Under 25 years Correlation Summary
| Measurement | Alsatian | Northern European |
| Minimum | $35,598 | $12,500 |
| Maximum | $113,281 | $71,017 |
| Range | $77,683 | $58,517 |
| Mean | $60,844 | $46,566 |
| Median | $50,662 | $51,044 |
| Interquartile 25% (IQ1) | $45,251 | $36,723 |
| Interquartile 75% (IQ3) | $78,194 | $53,780 |
| Interquartile Range (IQR) | $32,943 | $17,057 |
| Standard Deviation (Sample) | $25,229 | $16,138 |
| Standard Deviation (Population) | $23,786 | $15,551 |
Similar Demographics by Householder Income Under 25 years
Demographics Similar to Alsatians by Householder Income Under 25 years
In terms of householder income under 25 years, the demographic groups most similar to Alsatians are Nonimmigrants ($49,348, a difference of 0.16%), Immigrants from Nigeria ($49,174, a difference of 0.19%), Hmong ($49,364, a difference of 0.20%), Apache ($49,395, a difference of 0.26%), and Nigerian ($49,416, a difference of 0.30%).
| Demographics | Rating | Rank | Householder Income Under 25 years |
| Immigrants | Kenya | 0.2 /100 | #275 | Tragic $49,633 |
| Dominicans | 0.2 /100 | #276 | Tragic $49,633 |
| Immigrants | Western Africa | 0.2 /100 | #277 | Tragic $49,621 |
| Nigerians | 0.1 /100 | #278 | Tragic $49,416 |
| Apache | 0.1 /100 | #279 | Tragic $49,395 |
| Hmong | 0.1 /100 | #280 | Tragic $49,364 |
| Immigrants | Nonimmigrants | 0.1 /100 | #281 | Tragic $49,348 |
| Alsatians | 0.1 /100 | #282 | Tragic $49,267 |
| Immigrants | Nigeria | 0.1 /100 | #283 | Tragic $49,174 |
| Carpatho Rusyns | 0.1 /100 | #284 | Tragic $49,113 |
| Scotch-Irish | 0.0 /100 | #285 | Tragic $49,039 |
| French American Indians | 0.0 /100 | #286 | Tragic $48,977 |
| Senegalese | 0.0 /100 | #287 | Tragic $48,953 |
| Liberians | 0.0 /100 | #288 | Tragic $48,917 |
| Hondurans | 0.0 /100 | #289 | Tragic $48,885 |
Demographics Similar to Northern Europeans by Householder Income Under 25 years
In terms of householder income under 25 years, the demographic groups most similar to Northern Europeans are Croatian ($51,662, a difference of 0.030%), Immigrants from South Africa ($51,705, a difference of 0.050%), Alaskan Athabascan ($51,713, a difference of 0.070%), Immigrants from Latvia ($51,737, a difference of 0.11%), and Malaysian ($51,615, a difference of 0.12%).
| Demographics | Rating | Rank | Householder Income Under 25 years |
| Europeans | 27.6 /100 | #181 | Fair $51,796 |
| Jordanians | 27.6 /100 | #182 | Fair $51,796 |
| Mexican American Indians | 27.0 /100 | #183 | Fair $51,783 |
| Paiute | 25.1 /100 | #184 | Fair $51,743 |
| Immigrants | Latvia | 24.8 /100 | #185 | Fair $51,737 |
| Alaskan Athabascans | 23.8 /100 | #186 | Fair $51,713 |
| Immigrants | South Africa | 23.4 /100 | #187 | Fair $51,705 |
| Northern Europeans | 22.2 /100 | #188 | Fair $51,678 |
| Croatians | 21.6 /100 | #189 | Fair $51,662 |
| Malaysians | 19.7 /100 | #190 | Poor $51,615 |
| Panamanians | 19.5 /100 | #191 | Poor $51,611 |
| West Indians | 18.5 /100 | #192 | Poor $51,583 |
| Immigrants | Eritrea | 18.1 /100 | #193 | Poor $51,574 |
| Guatemalans | 16.4 /100 | #194 | Poor $51,525 |
| Estonians | 16.4 /100 | #195 | Poor $51,523 |