Black/African American vs Northern European Unemployment
COMPARE
Black/African American
Northern European
Unemployment
Unemployment Comparison
Blacks/African Americans
Northern Europeans
6.6%
UNEMPLOYMENT
0.0/ 100
METRIC RATING
314th/ 347
METRIC RANK
4.8%
UNEMPLOYMENT
99.7/ 100
METRIC RATING
40th/ 347
METRIC RANK
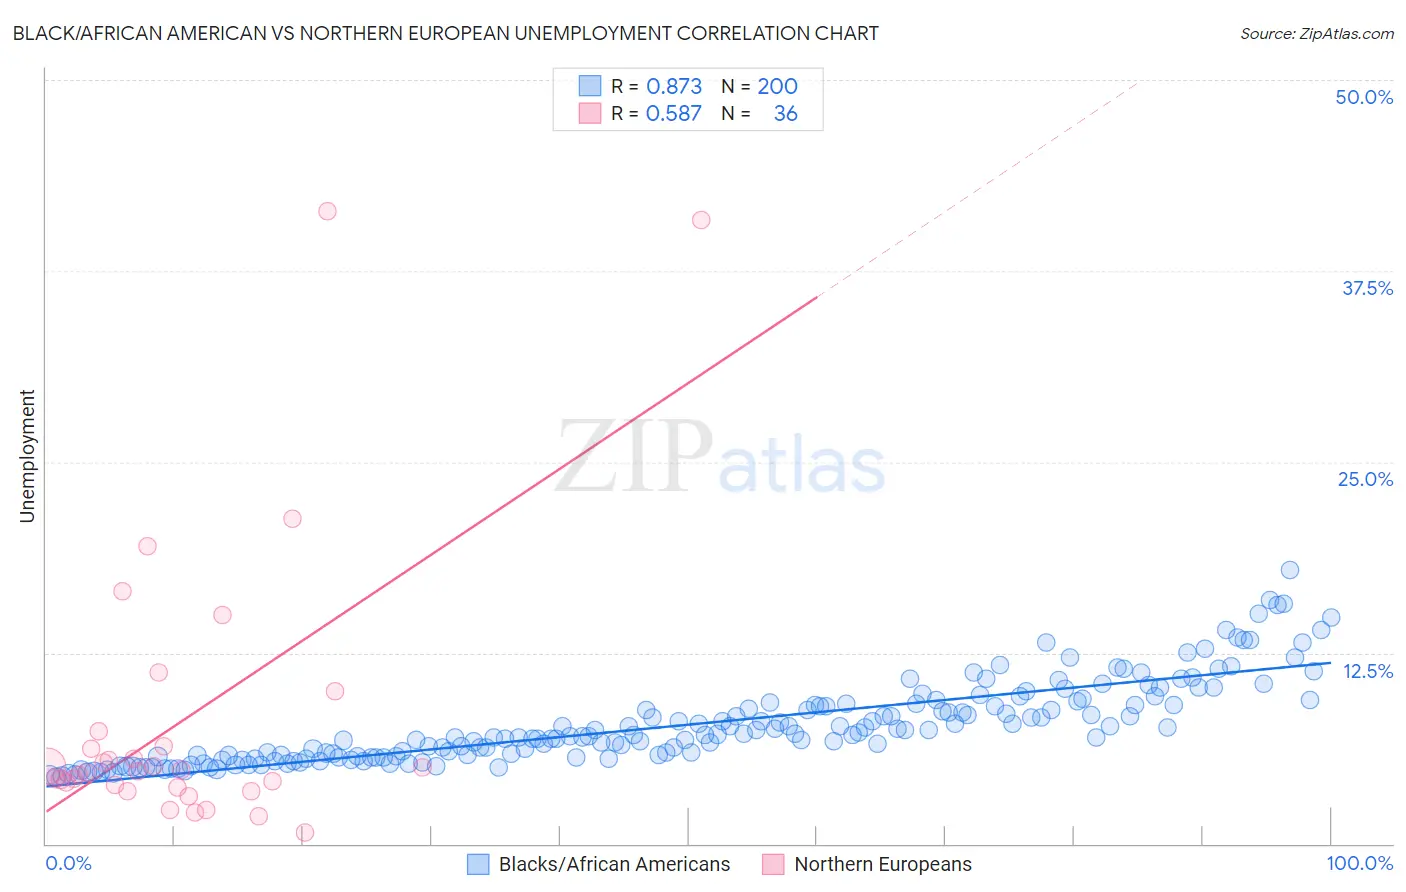
Black/African American vs Northern European Unemployment Correlation Chart
The statistical analysis conducted on geographies consisting of 562,987,434 people shows a very strong positive correlation between the proportion of Blacks/African Americans and unemployment in the United States with a correlation coefficient (R) of 0.873 and weighted average of 6.6%. Similarly, the statistical analysis conducted on geographies consisting of 405,473,873 people shows a substantial positive correlation between the proportion of Northern Europeans and unemployment in the United States with a correlation coefficient (R) of 0.587 and weighted average of 4.8%, a difference of 38.2%.
Unemployment Correlation Summary
| Measurement | Black/African American | Northern European |
| Minimum | 4.4% | 0.70% |
| Maximum | 17.9% | 41.4% |
| Range | 13.5% | 40.7% |
| Mean | 7.8% | 8.1% |
| Median | 7.1% | 4.8% |
| Interquartile 25% (IQ1) | 5.7% | 3.7% |
| Interquartile 75% (IQ3) | 9.1% | 6.9% |
| Interquartile Range (IQR) | 3.4% | 3.1% |
| Standard Deviation (Sample) | 2.7% | 9.4% |
| Standard Deviation (Population) | 2.7% | 9.3% |
Similar Demographics by Unemployment
Demographics Similar to Blacks/African Americans by Unemployment
In terms of unemployment, the demographic groups most similar to Blacks/African Americans are Immigrants from Barbados (6.6%, a difference of 0.55%), Houma (6.7%, a difference of 0.80%), Colville (6.6%, a difference of 0.93%), Cape Verdean (6.5%, a difference of 1.5%), and Immigrants from Dominica (6.7%, a difference of 1.6%).
| Demographics | Rating | Rank | Unemployment |
| Immigrants | Bangladesh | 0.0 /100 | #307 | Tragic 6.5% |
| Barbadians | 0.0 /100 | #308 | Tragic 6.5% |
| Vietnamese | 0.0 /100 | #309 | Tragic 6.5% |
| Immigrants | Belize | 0.0 /100 | #310 | Tragic 6.5% |
| Cape Verdeans | 0.0 /100 | #311 | Tragic 6.5% |
| Colville | 0.0 /100 | #312 | Tragic 6.6% |
| Immigrants | Barbados | 0.0 /100 | #313 | Tragic 6.6% |
| Blacks/African Americans | 0.0 /100 | #314 | Tragic 6.6% |
| Houma | 0.0 /100 | #315 | Tragic 6.7% |
| Immigrants | Dominica | 0.0 /100 | #316 | Tragic 6.7% |
| Shoshone | 0.0 /100 | #317 | Tragic 6.8% |
| Immigrants | Cabo Verde | 0.0 /100 | #318 | Tragic 6.8% |
| British West Indians | 0.0 /100 | #319 | Tragic 6.8% |
| Immigrants | St. Vincent and the Grenadines | 0.0 /100 | #320 | Tragic 6.9% |
| Immigrants | Guyana | 0.0 /100 | #321 | Tragic 6.9% |
Demographics Similar to Northern Europeans by Unemployment
In terms of unemployment, the demographic groups most similar to Northern Europeans are Lithuanian (4.8%, a difference of 0.020%), Immigrants from Bosnia and Herzegovina (4.8%, a difference of 0.030%), Bolivian (4.8%, a difference of 0.16%), Czechoslovakian (4.8%, a difference of 0.35%), and Tongan (4.8%, a difference of 0.42%).
| Demographics | Rating | Rank | Unemployment |
| Sudanese | 99.8 /100 | #33 | Exceptional 4.8% |
| Immigrants | Bolivia | 99.8 /100 | #34 | Exceptional 4.8% |
| Scotch-Irish | 99.8 /100 | #35 | Exceptional 4.8% |
| Tongans | 99.7 /100 | #36 | Exceptional 4.8% |
| Czechoslovakians | 99.7 /100 | #37 | Exceptional 4.8% |
| Bolivians | 99.7 /100 | #38 | Exceptional 4.8% |
| Lithuanians | 99.7 /100 | #39 | Exceptional 4.8% |
| Northern Europeans | 99.7 /100 | #40 | Exceptional 4.8% |
| Immigrants | Bosnia and Herzegovina | 99.7 /100 | #41 | Exceptional 4.8% |
| Filipinos | 99.5 /100 | #42 | Exceptional 4.8% |
| Yugoslavians | 99.5 /100 | #43 | Exceptional 4.8% |
| Austrians | 99.5 /100 | #44 | Exceptional 4.8% |
| French | 99.5 /100 | #45 | Exceptional 4.8% |
| Immigrants | Nepal | 99.4 /100 | #46 | Exceptional 4.8% |
| Immigrants | Taiwan | 99.4 /100 | #47 | Exceptional 4.8% |