Black/African American vs Cambodian Householder Income Under 25 years

COMPARE

Black/African American
Race
Ancestry
AfghanAfricanAlaska NativeAlaskan AthabascanAlbanianAleutAlsatianAmericanApacheArabArapahoArgentineanArmenianAssyrian/Chaldean/SyriacAustralianAustrianBahamianBangladeshiBarbadianBasqueBelgianBelizeanBermudanBhutaneseBlackfeetBolivianBrazilianBritishBritish West IndianBulgarianBurmeseCajunCanadianCape VerdeanCarpatho RusynCelticCentral AmericanCentral American IndianCherokeeCheyenneChickasawChileanChineseChippewaChoctawColombianColvilleComancheCosta RicanCreeCreekCroatianCrowCubanCypriotCzechCzechoslovakianDanishDelawareDominicanDutchDutch West IndianEastern EuropeanEcuadorianEgyptianEnglishEstonianEthiopianEuropeanFijianFilipinoFinnishFrenchFrench American IndianFrench CanadianGermanGerman RussianGhanaianGreekGuamanian/ChamorroGuatemalanGuyaneseHaitianHmongHonduranHopiHoumaHungarianIcelanderIndian (Asian)IndonesianInupiatIranianIraqiIrishIroquoisIsraeliItalianJamaicanJapaneseJordanianKenyanKiowaKoreanLaotianLatvianLebaneseLiberianLithuanianLumbeeLuxembourgerMacedonianMalaysianMalteseMarshalleseMenomineeMexicanMexican American IndianMongolianMoroccanNative HawaiianNavajoNepaleseNew ZealanderNicaraguanNigerianNorthern EuropeanNorwegianOkinawanOsageOttawaPaiutePakistaniPalestinianPanamanianParaguayanPennsylvania GermanPeruvianPimaPolishPortuguesePotawatomiPuebloPuerto RicanPuget Sound SalishRomanianRussianSalvadoranSamoanScandinavianScotch-IrishScottishSeminoleSenegaleseSerbianShoshoneSierra LeoneanSiouxSlavicSlovakSloveneSomaliSouth AfricanSouth AmericanSouth American IndianSoviet UnionSpaniardSpanishSpanish AmericanSpanish American IndianSri LankanSubsaharan AfricanSudaneseSwedishSwissSyrianTaiwaneseThaiTlingit-HaidaTohono O'OdhamTonganTrinidadian and TobagonianTsimshianTurkishU.S. Virgin IslanderUgandanUkrainianUruguayanUteVenezuelanVietnameseWelshWest IndianYakamaYaquiYugoslavianYumanYup'ikZimbabwean
Immigration
NonimmigrantsImmigrantsAfghanistanAfricaAlbaniaArgentinaArmeniaAsiaAustraliaAustriaBahamasBangladeshBarbadosBelarusBelgiumBelizeBoliviaBosnia and HerzegovinaBrazilBulgariaBurma/MyanmarCabo VerdeCambodiaCameroonCanadaCaribbeanCentral AmericaChileChinaColombiaCongoCosta RicaCroatiaCubaCzechoslovakiaDenmarkDominicaDominican RepublicEastern AfricaEastern AsiaEastern EuropeEcuadorEgyptEl SalvadorEnglandEritreaEthiopiaEuropeFijiFranceGermanyGhanaGreeceGrenadaGuatemalaGuyanaHaitiHondurasHong KongHungaryIndiaIndonesiaIranIraqIrelandIsraelItalyJamaicaJapanJordanKazakhstanKenyaKoreaKuwaitLaosLatin AmericaLatviaLebanonLiberiaLithuaniaMalaysiaMexicoMicronesiaMiddle AfricaMoldovaMoroccoNepalNetherlandsNicaraguaNigeriaNorth AmericaNorth MacedoniaNorthern AfricaNorthern EuropeNorwayOceaniaPakistanPanamaPeruPhilippinesPolandPortugalRomaniaRussiaSaudi ArabiaScotlandSenegalSerbiaSierra LeoneSingaporeSomaliaSouth AfricaSouth AmericaSouth Central AsiaSouth Eastern AsiaSouthern EuropeSpainSri LankaSt. Vincent and the GrenadinesSudanSwedenSwitzerlandSyriaTaiwanThailandTrinidad and TobagoTurkeyUgandaUkraineUruguayUzbekistanVenezuelaVietnamWest IndiesWestern AfricaWestern AsiaWestern EuropeYemenZaireZimbabweAzores
Cambodian
Race
Ancestry
AfghanAfricanAlaska NativeAlaskan AthabascanAlbanianAleutAlsatianAmericanApacheArabArapahoArgentineanArmenianAssyrian/Chaldean/SyriacAustralianAustrianBahamianBangladeshiBarbadianBasqueBelgianBelizeanBermudanBhutaneseBlackfeetBolivianBrazilianBritishBritish West IndianBulgarianBurmeseCajunCambodianCanadianCape VerdeanCarpatho RusynCelticCentral AmericanCentral American IndianCherokeeCheyenneChickasawChileanChineseChippewaChoctawColombianColvilleComancheCosta RicanCreeCreekCroatianCrowCubanCypriotCzechCzechoslovakianDanishDelawareDominicanDutchDutch West IndianEastern EuropeanEcuadorianEgyptianEnglishEstonianEthiopianEuropeanFijianFilipinoFinnishFrenchFrench American IndianFrench CanadianGermanGerman RussianGhanaianGreekGuamanian/ChamorroGuatemalanGuyaneseHaitianHmongHonduranHopiHoumaHungarianIcelanderIndian (Asian)IndonesianInupiatIranianIraqiIrishIroquoisIsraeliItalianJamaicanJapaneseJordanianKenyanKiowaKoreanLaotianLatvianLebaneseLiberianLithuanianLumbeeLuxembourgerMacedonianMalaysianMalteseMarshalleseMenomineeMexicanMexican American IndianMongolianMoroccanNative HawaiianNavajoNepaleseNew ZealanderNicaraguanNigerianNorthern EuropeanNorwegianOkinawanOsageOttawaPaiutePakistaniPalestinianPanamanianParaguayanPennsylvania GermanPeruvianPimaPolishPortuguesePotawatomiPuebloPuerto RicanPuget Sound SalishRomanianRussianSalvadoranSamoanScandinavianScotch-IrishScottishSeminoleSenegaleseSerbianShoshoneSierra LeoneanSiouxSlavicSlovakSloveneSomaliSouth AfricanSouth AmericanSouth American IndianSoviet UnionSpaniardSpanishSpanish AmericanSpanish American IndianSri LankanSubsaharan AfricanSudaneseSwedishSwissSyrianTaiwaneseThaiTlingit-HaidaTohono O'OdhamTonganTrinidadian and TobagonianTsimshianTurkishU.S. Virgin IslanderUgandanUkrainianUruguayanUteVenezuelanVietnameseWelshWest IndianYakamaYaquiYugoslavianYumanYup'ikZimbabwean
Immigration
NonimmigrantsImmigrantsAfghanistanAfricaAlbaniaArgentinaArmeniaAsiaAustraliaAustriaBahamasBangladeshBarbadosBelarusBelgiumBelizeBoliviaBosnia and HerzegovinaBrazilBulgariaBurma/MyanmarCabo VerdeCambodiaCameroonCanadaCaribbeanCentral AmericaChileChinaColombiaCongoCosta RicaCroatiaCubaCzechoslovakiaDenmarkDominicaDominican RepublicEastern AfricaEastern AsiaEastern EuropeEcuadorEgyptEl SalvadorEnglandEritreaEthiopiaEuropeFijiFranceGermanyGhanaGreeceGrenadaGuatemalaGuyanaHaitiHondurasHong KongHungaryIndiaIndonesiaIranIraqIrelandIsraelItalyJamaicaJapanJordanKazakhstanKenyaKoreaKuwaitLaosLatin AmericaLatviaLebanonLiberiaLithuaniaMalaysiaMexicoMicronesiaMiddle AfricaMoldovaMoroccoNepalNetherlandsNicaraguaNigeriaNorth AmericaNorth MacedoniaNorthern AfricaNorthern EuropeNorwayOceaniaPakistanPanamaPeruPhilippinesPolandPortugalRomaniaRussiaSaudi ArabiaScotlandSenegalSerbiaSierra LeoneSingaporeSomaliaSouth AfricaSouth AmericaSouth Central AsiaSouth Eastern AsiaSouthern EuropeSpainSri LankaSt. Vincent and the GrenadinesSudanSwedenSwitzerlandSyriaTaiwanThailandTrinidad and TobagoTurkeyUgandaUkraineUruguayUzbekistanVenezuelaVietnamWest IndiesWestern AfricaWestern AsiaWestern EuropeYemenZaireZimbabweAzores
Householder Income Under 25 years
Income
Poverty
Unemployment
Labor Participation
Family Structure
Vehicle Availability
Education Level
Disability

Householder Income Under 25 years Comparison

Blacks/African Americans

Cambodians

Tragic
Exceptional
$44,381
HOUSEHOLDER INCOME UNDER 25 YEARS
0.0/ 100
METRIC RATING
340th/ 347
METRIC RANK
$55,571
HOUSEHOLDER INCOME UNDER 25 YEARS
100.0/ 100
METRIC RATING
47th/ 347
METRIC RANK

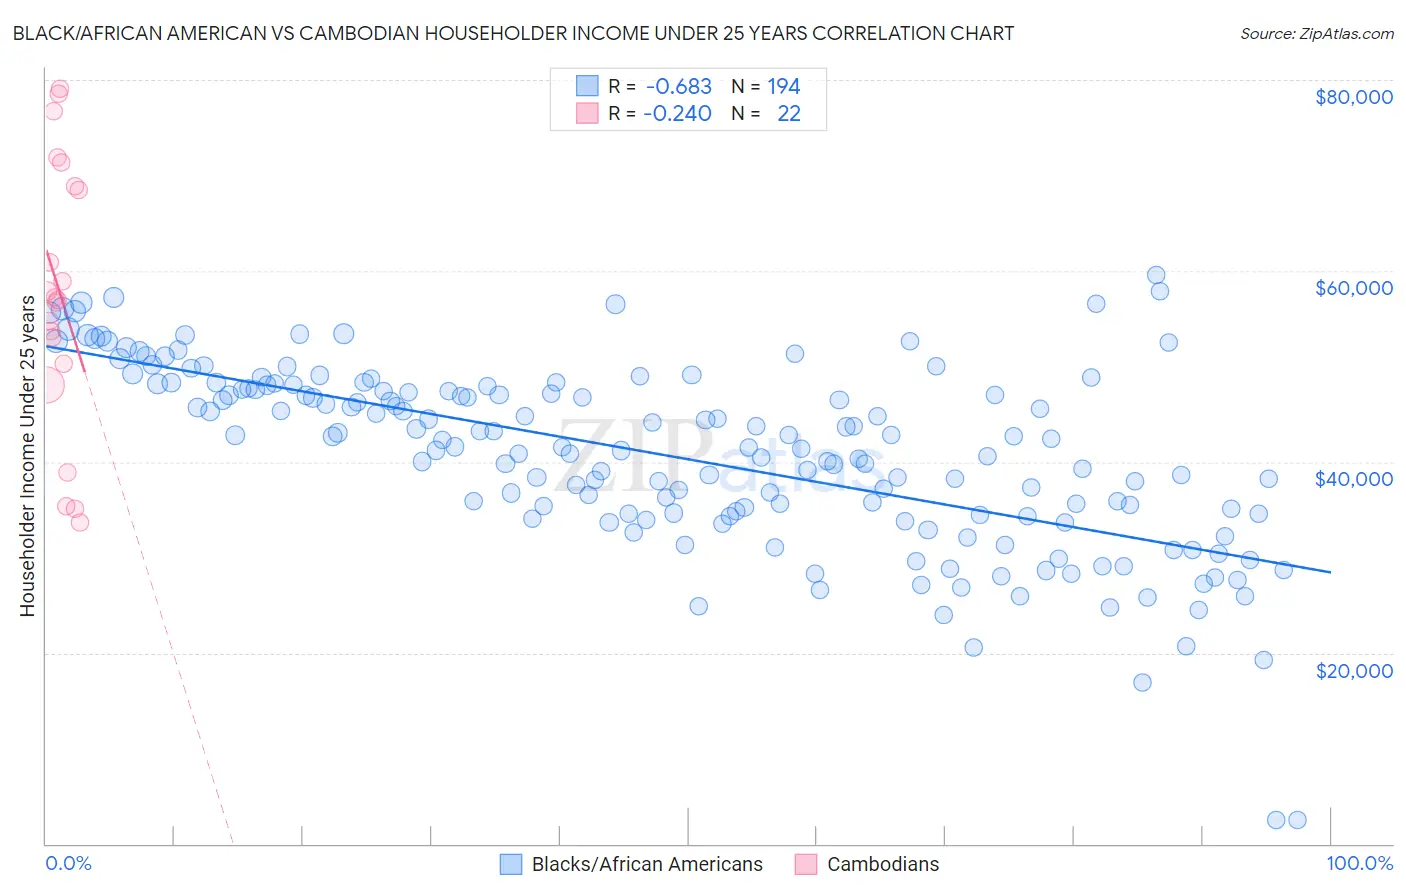
Black/African American vs Cambodian Householder Income Under 25 years Correlation Chart

The statistical analysis conducted on geographies consisting of 438,583,318 people shows a significant negative correlation between the proportion of Blacks/African Americans and household income with householder under the age of 25 in the United States with a correlation coefficient (R) of -0.683 and weighted average of $44,381. Similarly, the statistical analysis conducted on geographies consisting of 96,374,158 people shows a weak negative correlation between the proportion of Cambodians and household income with householder under the age of 25 in the United States with a correlation coefficient (R) of -0.240 and weighted average of $55,571, a difference of 25.2%.
Black/African American vs Cambodian Householder Income Under 25 years

Householder Income Under 25 years Correlation Summary

MeasurementBlack/African AmericanCambodian
Minimum$2,499$33,698
Maximum$59,638$79,145
Range$57,139$45,447
Mean$40,625$57,571
Median$41,554$57,095
Interquartile 25% (IQ1)$34,429$50,277
Interquartile 75% (IQ3)$47,684$68,894
Interquartile Range (IQR)$13,255$18,617
Standard Deviation (Sample)$9,747$13,871
Standard Deviation (Population)$9,722$13,553

Similar Demographics by Householder Income Under 25 years

Demographics Similar to Blacks/African Americans by Householder Income Under 25 years

In terms of householder income under 25 years, the demographic groups most similar to Blacks/African Americans are Houma ($44,356, a difference of 0.060%), Kiowa ($44,733, a difference of 0.79%), Chickasaw ($44,763, a difference of 0.86%), Arapaho ($44,003, a difference of 0.86%), and Pueblo ($45,018, a difference of 1.4%).
DemographicsRating | RankHouseholder Income Under 25 years
Creek
0.0
/100
|
#333
Tragic
$45,371
Cajuns
0.0
/100
|
#334
Tragic
$45,338
Cheyenne
0.0
/100
|
#335
Tragic
$45,275
Tohono O'odham
0.0
/100
|
#336
Tragic
$45,248
Pueblo
0.0
/100
|
#337
Tragic
$45,018
Chickasaw
0.0
/100
|
#338
Tragic
$44,763
Kiowa
0.0
/100
|
#339
Tragic
$44,733
Blacks/African Americans
0.0
/100
|
#340
Tragic
$44,381
Houma
0.0
/100
|
#341
Tragic
$44,356
Arapaho
0.0
/100
|
#342
Tragic
$44,003
Immigrants | Yemen
0.0
/100
|
#343
Tragic
$43,591
Immigrants | Congo
0.0
/100
|
#344
Tragic
$43,266
Navajo
0.0
/100
|
#345
Tragic
$42,380
Puerto Ricans
0.0
/100
|
#346
Tragic
$39,726
Lumbee
0.0
/100
|
#347
Tragic
$34,584

Demographics Similar to Cambodians by Householder Income Under 25 years

In terms of householder income under 25 years, the demographic groups most similar to Cambodians are Spanish American Indian ($55,573, a difference of 0.0%), Immigrants from Eastern Europe ($55,572, a difference of 0.0%), Immigrants from Vietnam ($55,562, a difference of 0.020%), Iranian ($55,548, a difference of 0.040%), and Puget Sound Salish ($55,543, a difference of 0.050%).
DemographicsRating | RankHouseholder Income Under 25 years
Immigrants | Greece
100.0
/100
|
#40
Exceptional
$55,727
Immigrants | Guyana
100.0
/100
|
#41
Exceptional
$55,726
Immigrants | Korea
100.0
/100
|
#42
Exceptional
$55,716
Immigrants | South Eastern Asia
100.0
/100
|
#43
Exceptional
$55,714
Paraguayans
100.0
/100
|
#44
Exceptional
$55,614
Spanish American Indians
100.0
/100
|
#45
Exceptional
$55,573
Immigrants | Eastern Europe
100.0
/100
|
#46
Exceptional
$55,572
Cambodians
100.0
/100
|
#47
Exceptional
$55,571
Immigrants | Vietnam
100.0
/100
|
#48
Exceptional
$55,562
Iranians
100.0
/100
|
#49
Exceptional
$55,548
Puget Sound Salish
100.0
/100
|
#50
Exceptional
$55,543
Immigrants | Romania
100.0
/100
|
#51
Exceptional
$55,522
Immigrants | Indonesia
100.0
/100
|
#52
Exceptional
$55,521
Immigrants | Poland
100.0
/100
|
#53
Exceptional
$55,474
Sri Lankans
100.0
/100
|
#54
Exceptional
$55,470