Black/African American vs Yup'ik Householder Income Under 25 years
COMPARE
Black/African American
Yup'ik
Householder Income Under 25 years
Householder Income Under 25 years Comparison
Blacks/African Americans
Yup'ik
$44,381
HOUSEHOLDER INCOME UNDER 25 YEARS
0.0/ 100
METRIC RATING
340th/ 347
METRIC RANK
$54,732
HOUSEHOLDER INCOME UNDER 25 YEARS
99.8/ 100
METRIC RATING
65th/ 347
METRIC RANK
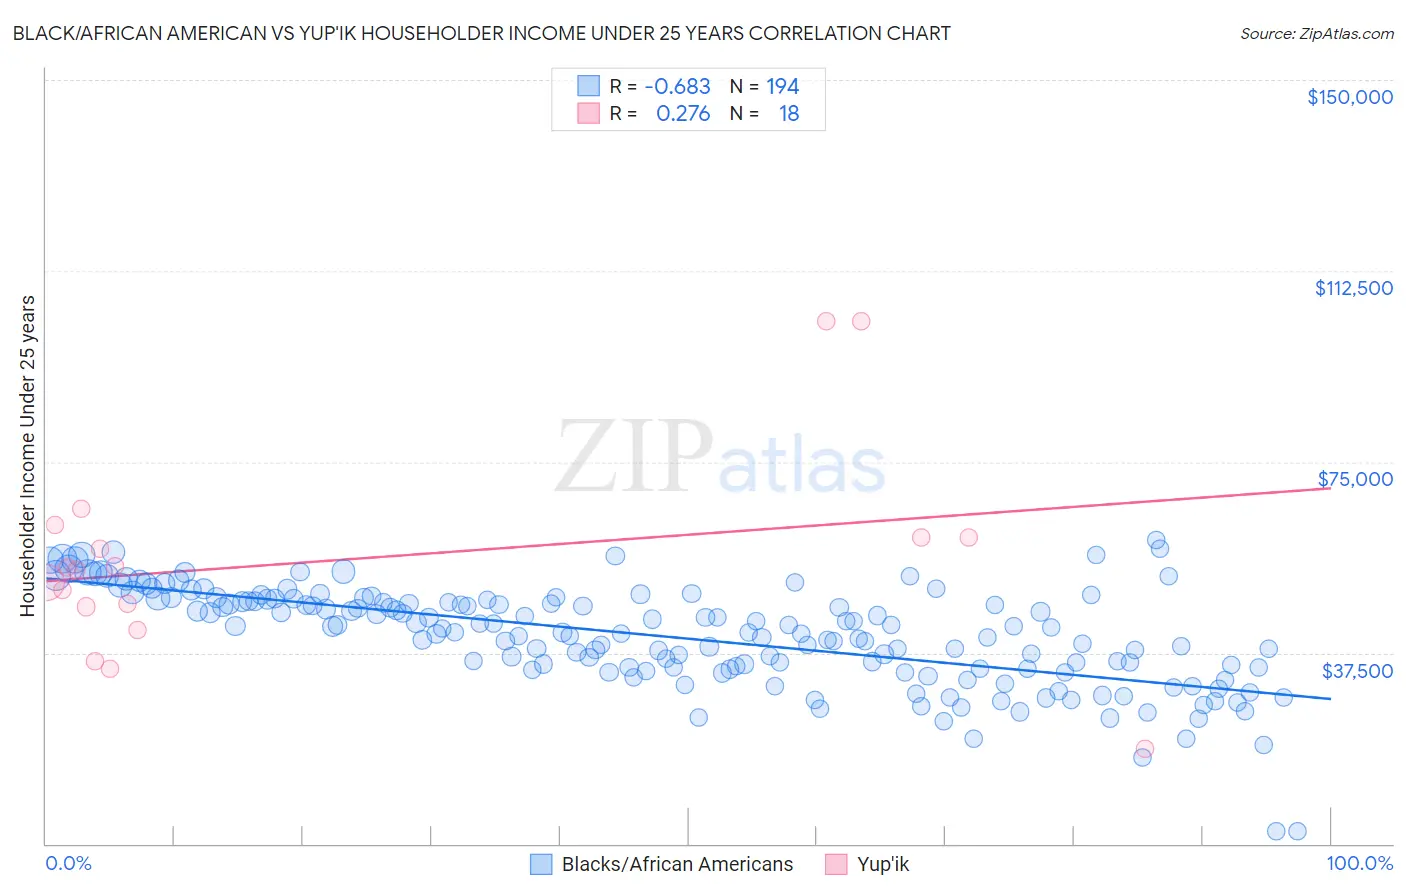
Black/African American vs Yup'ik Householder Income Under 25 years Correlation Chart
The statistical analysis conducted on geographies consisting of 438,583,318 people shows a significant negative correlation between the proportion of Blacks/African Americans and household income with householder under the age of 25 in the United States with a correlation coefficient (R) of -0.683 and weighted average of $44,381. Similarly, the statistical analysis conducted on geographies consisting of 38,257,105 people shows a weak positive correlation between the proportion of Yup'ik and household income with householder under the age of 25 in the United States with a correlation coefficient (R) of 0.276 and weighted average of $54,732, a difference of 23.3%.
Householder Income Under 25 years Correlation Summary
| Measurement | Black/African American | Yup'ik |
| Minimum | $2,499 | $18,750 |
| Maximum | $59,638 | $102,500 |
| Range | $57,139 | $83,750 |
| Mean | $40,625 | $55,559 |
| Median | $41,554 | $54,036 |
| Interquartile 25% (IQ1) | $34,429 | $46,548 |
| Interquartile 75% (IQ3) | $47,684 | $60,268 |
| Interquartile Range (IQR) | $13,255 | $13,720 |
| Standard Deviation (Sample) | $9,747 | $20,577 |
| Standard Deviation (Population) | $9,722 | $19,998 |
Similar Demographics by Householder Income Under 25 years
Demographics Similar to Blacks/African Americans by Householder Income Under 25 years
In terms of householder income under 25 years, the demographic groups most similar to Blacks/African Americans are Houma ($44,356, a difference of 0.060%), Kiowa ($44,733, a difference of 0.79%), Chickasaw ($44,763, a difference of 0.86%), Arapaho ($44,003, a difference of 0.86%), and Pueblo ($45,018, a difference of 1.4%).
| Demographics | Rating | Rank | Householder Income Under 25 years |
| Creek | 0.0 /100 | #333 | Tragic $45,371 |
| Cajuns | 0.0 /100 | #334 | Tragic $45,338 |
| Cheyenne | 0.0 /100 | #335 | Tragic $45,275 |
| Tohono O'odham | 0.0 /100 | #336 | Tragic $45,248 |
| Pueblo | 0.0 /100 | #337 | Tragic $45,018 |
| Chickasaw | 0.0 /100 | #338 | Tragic $44,763 |
| Kiowa | 0.0 /100 | #339 | Tragic $44,733 |
| Blacks/African Americans | 0.0 /100 | #340 | Tragic $44,381 |
| Houma | 0.0 /100 | #341 | Tragic $44,356 |
| Arapaho | 0.0 /100 | #342 | Tragic $44,003 |
| Immigrants | Yemen | 0.0 /100 | #343 | Tragic $43,591 |
| Immigrants | Congo | 0.0 /100 | #344 | Tragic $43,266 |
| Navajo | 0.0 /100 | #345 | Tragic $42,380 |
| Puerto Ricans | 0.0 /100 | #346 | Tragic $39,726 |
| Lumbee | 0.0 /100 | #347 | Tragic $34,584 |
Demographics Similar to Yup'ik by Householder Income Under 25 years
In terms of householder income under 25 years, the demographic groups most similar to Yup'ik are Immigrants from Bangladesh ($54,714, a difference of 0.030%), Okinawan ($54,701, a difference of 0.060%), Burmese ($54,800, a difference of 0.12%), Tsimshian ($54,649, a difference of 0.15%), and Immigrants from Belgium ($54,830, a difference of 0.18%).
| Demographics | Rating | Rank | Householder Income Under 25 years |
| Guyanese | 99.9 /100 | #58 | Exceptional $55,210 |
| Native Hawaiians | 99.9 /100 | #59 | Exceptional $55,158 |
| Immigrants | Lithuania | 99.9 /100 | #60 | Exceptional $55,028 |
| Immigrants | Europe | 99.9 /100 | #61 | Exceptional $55,022 |
| Immigrants | Uzbekistan | 99.8 /100 | #62 | Exceptional $54,846 |
| Immigrants | Belgium | 99.8 /100 | #63 | Exceptional $54,830 |
| Burmese | 99.8 /100 | #64 | Exceptional $54,800 |
| Yup'ik | 99.8 /100 | #65 | Exceptional $54,732 |
| Immigrants | Bangladesh | 99.8 /100 | #66 | Exceptional $54,714 |
| Okinawans | 99.8 /100 | #67 | Exceptional $54,701 |
| Tsimshian | 99.8 /100 | #68 | Exceptional $54,649 |
| Samoans | 99.7 /100 | #69 | Exceptional $54,610 |
| Immigrants | El Salvador | 99.7 /100 | #70 | Exceptional $54,599 |
| Immigrants | Morocco | 99.7 /100 | #71 | Exceptional $54,593 |
| Immigrants | Northern Europe | 99.7 /100 | #72 | Exceptional $54,571 |