Black/African American vs Turkish Householder Income Under 25 years
COMPARE
Black/African American
Turkish
Householder Income Under 25 years
Householder Income Under 25 years Comparison
Blacks/African Americans
Turks
$44,381
HOUSEHOLDER INCOME UNDER 25 YEARS
0.0/ 100
METRIC RATING
340th/ 347
METRIC RANK
$54,266
HOUSEHOLDER INCOME UNDER 25 YEARS
99.4/ 100
METRIC RATING
90th/ 347
METRIC RANK
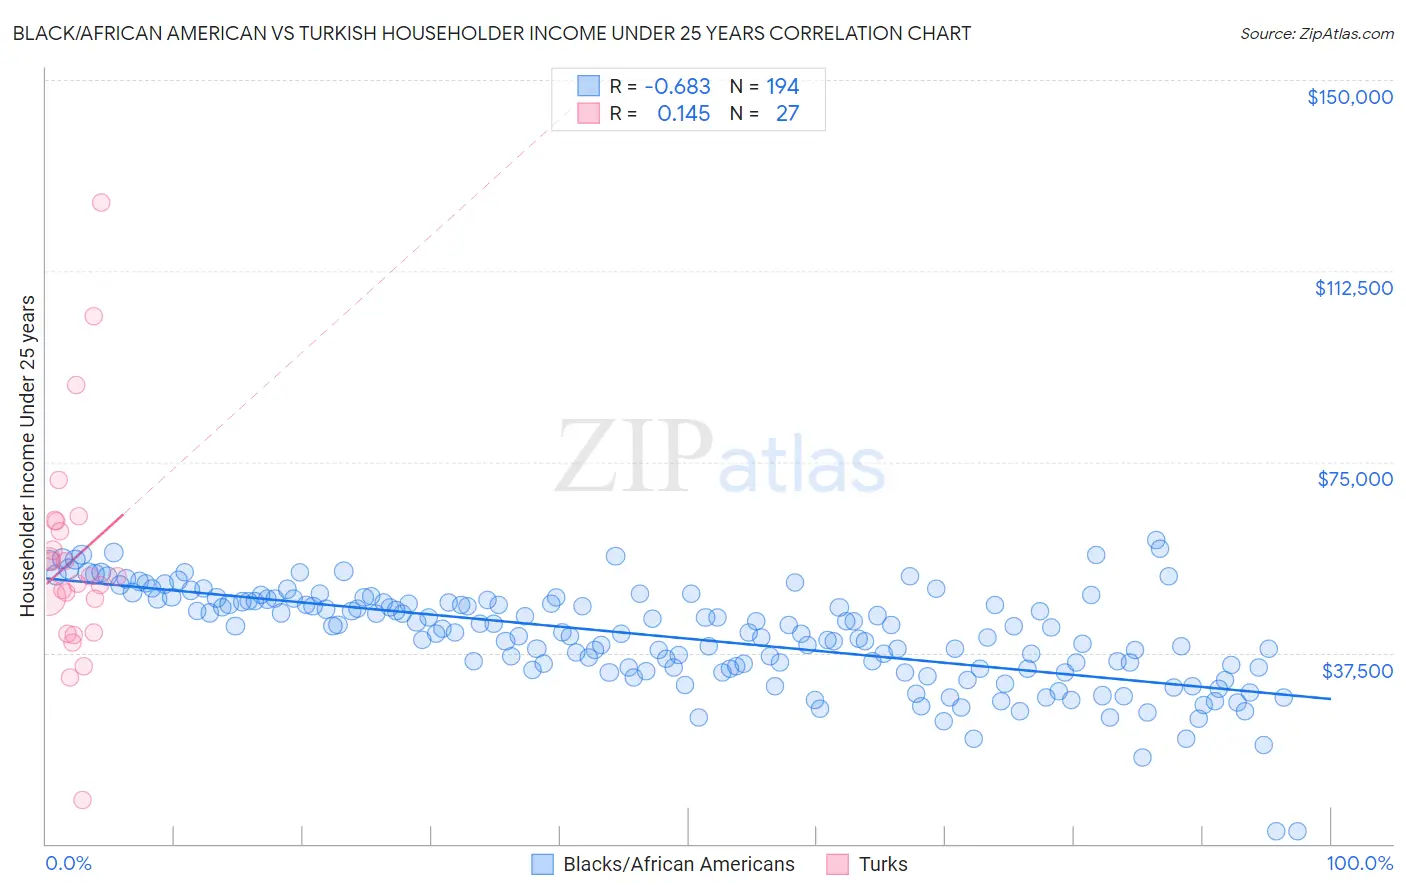
Black/African American vs Turkish Householder Income Under 25 years Correlation Chart
The statistical analysis conducted on geographies consisting of 438,583,318 people shows a significant negative correlation between the proportion of Blacks/African Americans and household income with householder under the age of 25 in the United States with a correlation coefficient (R) of -0.683 and weighted average of $44,381. Similarly, the statistical analysis conducted on geographies consisting of 234,402,010 people shows a poor positive correlation between the proportion of Turks and household income with householder under the age of 25 in the United States with a correlation coefficient (R) of 0.145 and weighted average of $54,266, a difference of 22.3%.
Householder Income Under 25 years Correlation Summary
| Measurement | Black/African American | Turkish |
| Minimum | $2,499 | $8,508 |
| Maximum | $59,638 | $125,890 |
| Range | $57,139 | $117,382 |
| Mean | $40,625 | $55,917 |
| Median | $41,554 | $52,500 |
| Interquartile 25% (IQ1) | $34,429 | $41,438 |
| Interquartile 75% (IQ3) | $47,684 | $63,275 |
| Interquartile Range (IQR) | $13,255 | $21,837 |
| Standard Deviation (Sample) | $9,747 | $22,543 |
| Standard Deviation (Population) | $9,722 | $22,121 |
Similar Demographics by Householder Income Under 25 years
Demographics Similar to Blacks/African Americans by Householder Income Under 25 years
In terms of householder income under 25 years, the demographic groups most similar to Blacks/African Americans are Houma ($44,356, a difference of 0.060%), Kiowa ($44,733, a difference of 0.79%), Chickasaw ($44,763, a difference of 0.86%), Arapaho ($44,003, a difference of 0.86%), and Pueblo ($45,018, a difference of 1.4%).
| Demographics | Rating | Rank | Householder Income Under 25 years |
| Creek | 0.0 /100 | #333 | Tragic $45,371 |
| Cajuns | 0.0 /100 | #334 | Tragic $45,338 |
| Cheyenne | 0.0 /100 | #335 | Tragic $45,275 |
| Tohono O'odham | 0.0 /100 | #336 | Tragic $45,248 |
| Pueblo | 0.0 /100 | #337 | Tragic $45,018 |
| Chickasaw | 0.0 /100 | #338 | Tragic $44,763 |
| Kiowa | 0.0 /100 | #339 | Tragic $44,733 |
| Blacks/African Americans | 0.0 /100 | #340 | Tragic $44,381 |
| Houma | 0.0 /100 | #341 | Tragic $44,356 |
| Arapaho | 0.0 /100 | #342 | Tragic $44,003 |
| Immigrants | Yemen | 0.0 /100 | #343 | Tragic $43,591 |
| Immigrants | Congo | 0.0 /100 | #344 | Tragic $43,266 |
| Navajo | 0.0 /100 | #345 | Tragic $42,380 |
| Puerto Ricans | 0.0 /100 | #346 | Tragic $39,726 |
| Lumbee | 0.0 /100 | #347 | Tragic $34,584 |
Demographics Similar to Turks by Householder Income Under 25 years
In terms of householder income under 25 years, the demographic groups most similar to Turks are Immigrants from South America ($54,268, a difference of 0.0%), Immigrants from Egypt ($54,239, a difference of 0.050%), Immigrants from St. Vincent and the Grenadines ($54,230, a difference of 0.070%), Yakama ($54,321, a difference of 0.10%), and Immigrants from Argentina ($54,209, a difference of 0.10%).
| Demographics | Rating | Rank | Householder Income Under 25 years |
| Laotians | 99.5 /100 | #83 | Exceptional $54,369 |
| Bulgarians | 99.5 /100 | #84 | Exceptional $54,352 |
| Immigrants | Czechoslovakia | 99.5 /100 | #85 | Exceptional $54,352 |
| Immigrants | Croatia | 99.5 /100 | #86 | Exceptional $54,343 |
| Brazilians | 99.5 /100 | #87 | Exceptional $54,335 |
| Yakama | 99.5 /100 | #88 | Exceptional $54,321 |
| Immigrants | South America | 99.4 /100 | #89 | Exceptional $54,268 |
| Turks | 99.4 /100 | #90 | Exceptional $54,266 |
| Immigrants | Egypt | 99.3 /100 | #91 | Exceptional $54,239 |
| Immigrants | St. Vincent and the Grenadines | 99.3 /100 | #92 | Exceptional $54,230 |
| Immigrants | Argentina | 99.3 /100 | #93 | Exceptional $54,209 |
| Immigrants | Sierra Leone | 99.3 /100 | #94 | Exceptional $54,190 |
| Immigrants | Malaysia | 99.2 /100 | #95 | Exceptional $54,179 |
| Argentineans | 99.2 /100 | #96 | Exceptional $54,154 |
| Immigrants | Portugal | 99.1 /100 | #97 | Exceptional $54,105 |