Portuguese vs Northern European Householder Income Under 25 years
COMPARE
Portuguese
Northern European
Householder Income Under 25 years
Householder Income Under 25 years Comparison
Portuguese
Northern Europeans
$54,436
HOUSEHOLDER INCOME UNDER 25 YEARS
99.6/ 100
METRIC RATING
81st/ 347
METRIC RANK
$51,678
HOUSEHOLDER INCOME UNDER 25 YEARS
22.2/ 100
METRIC RATING
188th/ 347
METRIC RANK
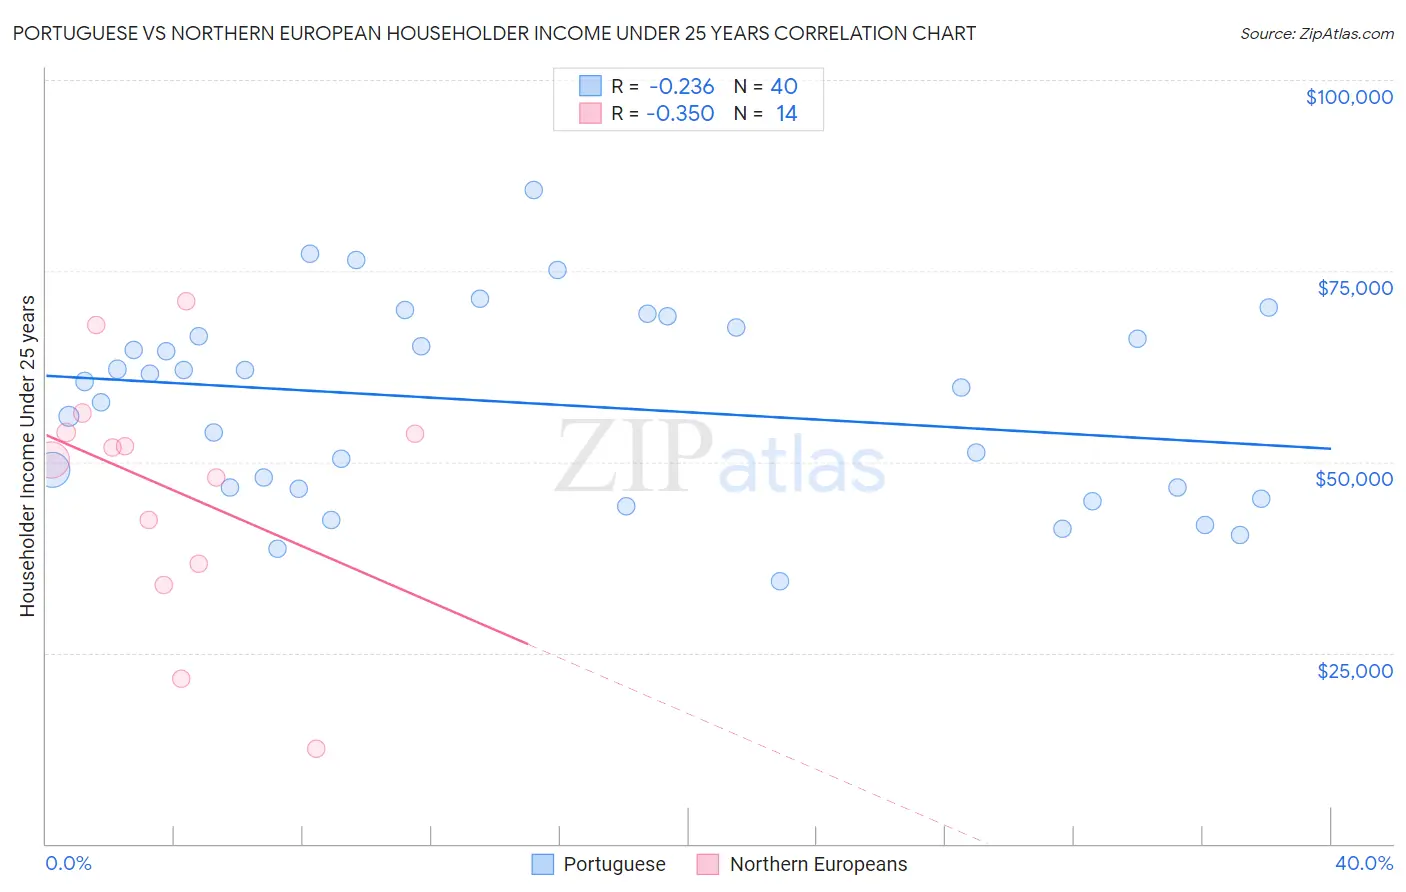
Portuguese vs Northern European Householder Income Under 25 years Correlation Chart
The statistical analysis conducted on geographies consisting of 369,014,384 people shows a weak negative correlation between the proportion of Portuguese and household income with householder under the age of 25 in the United States with a correlation coefficient (R) of -0.236 and weighted average of $54,436. Similarly, the statistical analysis conducted on geographies consisting of 340,537,384 people shows a mild negative correlation between the proportion of Northern Europeans and household income with householder under the age of 25 in the United States with a correlation coefficient (R) of -0.350 and weighted average of $51,678, a difference of 5.3%.
Householder Income Under 25 years Correlation Summary
| Measurement | Portuguese | Northern European |
| Minimum | $34,350 | $12,500 |
| Maximum | $85,677 | $71,017 |
| Range | $51,327 | $58,517 |
| Mean | $57,647 | $46,566 |
| Median | $60,100 | $51,044 |
| Interquartile 25% (IQ1) | $46,553 | $36,723 |
| Interquartile 75% (IQ3) | $67,025 | $53,780 |
| Interquartile Range (IQR) | $20,472 | $17,057 |
| Standard Deviation (Sample) | $12,592 | $16,138 |
| Standard Deviation (Population) | $12,434 | $15,551 |
Similar Demographics by Householder Income Under 25 years
Demographics Similar to Portuguese by Householder Income Under 25 years
In terms of householder income under 25 years, the demographic groups most similar to Portuguese are Egyptian ($54,444, a difference of 0.010%), Immigrants from Italy ($54,449, a difference of 0.020%), Nepalese ($54,472, a difference of 0.060%), Immigrants from Brazil ($54,487, a difference of 0.090%), and Immigrants from Southern Europe ($54,484, a difference of 0.090%).
| Demographics | Rating | Rank | Householder Income Under 25 years |
| Immigrants | Grenada | 99.7 /100 | #74 | Exceptional $54,538 |
| Immigrants | Sri Lanka | 99.7 /100 | #75 | Exceptional $54,512 |
| Immigrants | Brazil | 99.6 /100 | #76 | Exceptional $54,487 |
| Immigrants | Southern Europe | 99.6 /100 | #77 | Exceptional $54,484 |
| Nepalese | 99.6 /100 | #78 | Exceptional $54,472 |
| Immigrants | Italy | 99.6 /100 | #79 | Exceptional $54,449 |
| Egyptians | 99.6 /100 | #80 | Exceptional $54,444 |
| Portuguese | 99.6 /100 | #81 | Exceptional $54,436 |
| Russians | 99.5 /100 | #82 | Exceptional $54,389 |
| Laotians | 99.5 /100 | #83 | Exceptional $54,369 |
| Bulgarians | 99.5 /100 | #84 | Exceptional $54,352 |
| Immigrants | Czechoslovakia | 99.5 /100 | #85 | Exceptional $54,352 |
| Immigrants | Croatia | 99.5 /100 | #86 | Exceptional $54,343 |
| Brazilians | 99.5 /100 | #87 | Exceptional $54,335 |
| Yakama | 99.5 /100 | #88 | Exceptional $54,321 |
Demographics Similar to Northern Europeans by Householder Income Under 25 years
In terms of householder income under 25 years, the demographic groups most similar to Northern Europeans are Croatian ($51,662, a difference of 0.030%), Immigrants from South Africa ($51,705, a difference of 0.050%), Alaskan Athabascan ($51,713, a difference of 0.070%), Immigrants from Latvia ($51,737, a difference of 0.11%), and Malaysian ($51,615, a difference of 0.12%).
| Demographics | Rating | Rank | Householder Income Under 25 years |
| Europeans | 27.6 /100 | #181 | Fair $51,796 |
| Jordanians | 27.6 /100 | #182 | Fair $51,796 |
| Mexican American Indians | 27.0 /100 | #183 | Fair $51,783 |
| Paiute | 25.1 /100 | #184 | Fair $51,743 |
| Immigrants | Latvia | 24.8 /100 | #185 | Fair $51,737 |
| Alaskan Athabascans | 23.8 /100 | #186 | Fair $51,713 |
| Immigrants | South Africa | 23.4 /100 | #187 | Fair $51,705 |
| Northern Europeans | 22.2 /100 | #188 | Fair $51,678 |
| Croatians | 21.6 /100 | #189 | Fair $51,662 |
| Malaysians | 19.7 /100 | #190 | Poor $51,615 |
| Panamanians | 19.5 /100 | #191 | Poor $51,611 |
| West Indians | 18.5 /100 | #192 | Poor $51,583 |
| Immigrants | Eritrea | 18.1 /100 | #193 | Poor $51,574 |
| Guatemalans | 16.4 /100 | #194 | Poor $51,525 |
| Estonians | 16.4 /100 | #195 | Poor $51,523 |