American vs Immigrants from Senegal Wage/Income Gap
COMPARE
American
Immigrants from Senegal
Wage/Income Gap
Wage/Income Gap Comparison
Americans
Immigrants from Senegal
27.8%
WAGE/INCOME GAP
0.7/ 100
METRIC RATING
274th/ 347
METRIC RANK
20.9%
WAGE/INCOME GAP
100.0/ 100
METRIC RATING
29th/ 347
METRIC RANK
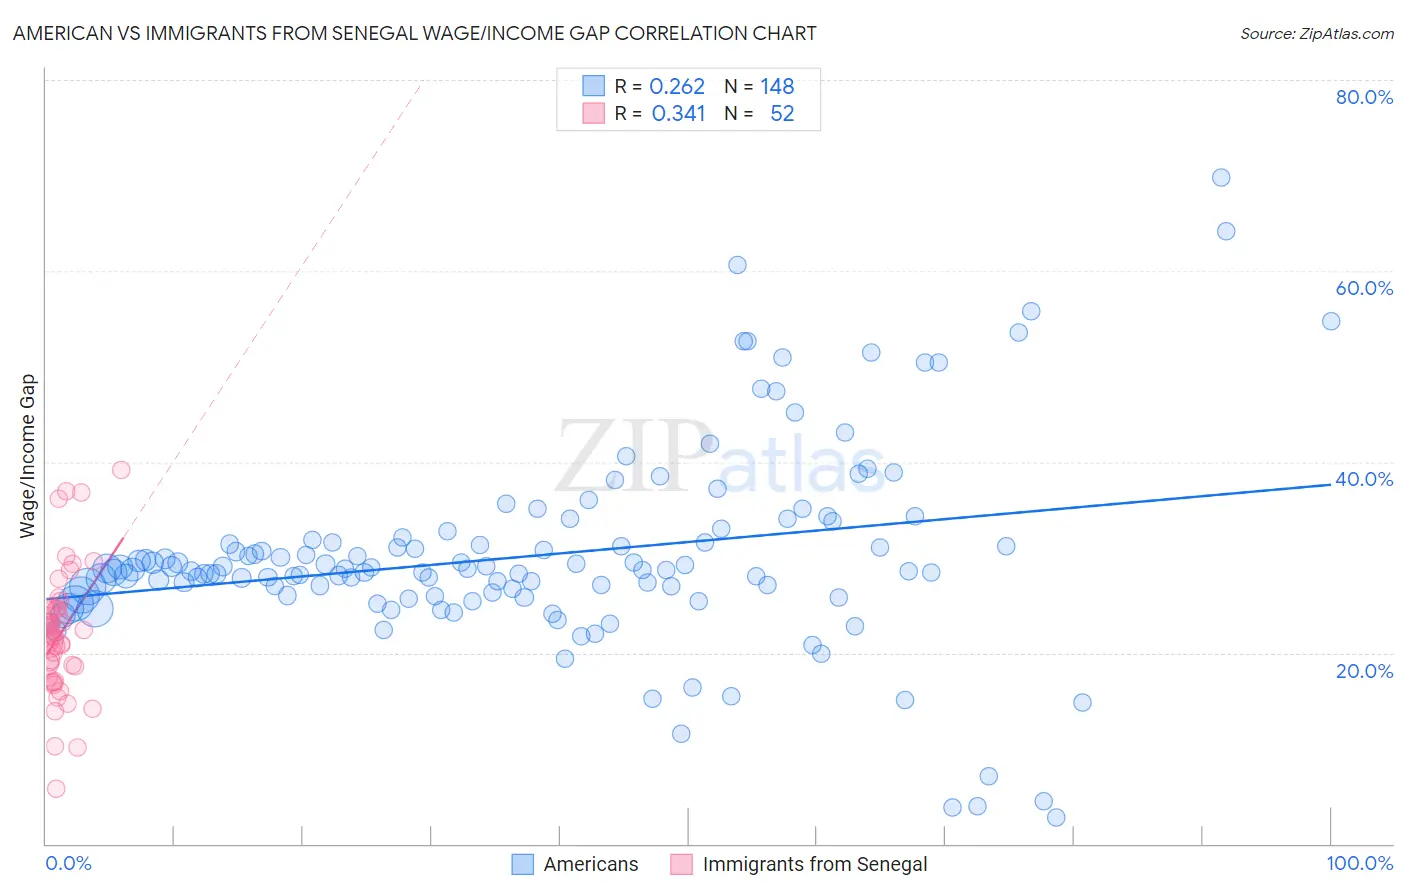
American vs Immigrants from Senegal Wage/Income Gap Correlation Chart
The statistical analysis conducted on geographies consisting of 577,977,110 people shows a weak positive correlation between the proportion of Americans and wage/income gap percentage in the United States with a correlation coefficient (R) of 0.262 and weighted average of 27.8%. Similarly, the statistical analysis conducted on geographies consisting of 90,124,089 people shows a mild positive correlation between the proportion of Immigrants from Senegal and wage/income gap percentage in the United States with a correlation coefficient (R) of 0.341 and weighted average of 20.9%, a difference of 33.2%.
Wage/Income Gap Correlation Summary
| Measurement | American | Immigrants from Senegal |
| Minimum | 2.7% | 5.7% |
| Maximum | 69.8% | 39.2% |
| Range | 67.1% | 33.4% |
| Mean | 30.2% | 22.0% |
| Median | 28.7% | 21.9% |
| Interquartile 25% (IQ1) | 26.0% | 18.0% |
| Interquartile 75% (IQ3) | 31.7% | 24.6% |
| Interquartile Range (IQR) | 5.7% | 6.6% |
| Standard Deviation (Sample) | 10.5% | 6.6% |
| Standard Deviation (Population) | 10.5% | 6.6% |
Similar Demographics by Wage/Income Gap
Demographics Similar to Americans by Wage/Income Gap
In terms of wage/income gap, the demographic groups most similar to Americans are Bulgarian (27.8%, a difference of 0.040%), Immigrants from Japan (27.9%, a difference of 0.080%), Lebanese (27.9%, a difference of 0.11%), Latvian (27.9%, a difference of 0.11%), and Immigrants from Korea (27.8%, a difference of 0.15%).
| Demographics | Rating | Rank | Wage/Income Gap |
| Turks | 1.0 /100 | #267 | Tragic 27.7% |
| New Zealanders | 1.0 /100 | #268 | Tragic 27.7% |
| Potawatomi | 0.9 /100 | #269 | Tragic 27.7% |
| Immigrants | Western Europe | 0.9 /100 | #270 | Tragic 27.8% |
| Ute | 0.8 /100 | #271 | Tragic 27.8% |
| Immigrants | Korea | 0.8 /100 | #272 | Tragic 27.8% |
| Bulgarians | 0.7 /100 | #273 | Tragic 27.8% |
| Americans | 0.7 /100 | #274 | Tragic 27.8% |
| Immigrants | Japan | 0.7 /100 | #275 | Tragic 27.9% |
| Lebanese | 0.7 /100 | #276 | Tragic 27.9% |
| Latvians | 0.7 /100 | #277 | Tragic 27.9% |
| Immigrants | England | 0.6 /100 | #278 | Tragic 27.9% |
| Romanians | 0.5 /100 | #279 | Tragic 28.0% |
| Russians | 0.5 /100 | #280 | Tragic 28.0% |
| Burmese | 0.5 /100 | #281 | Tragic 28.0% |
Demographics Similar to Immigrants from Senegal by Wage/Income Gap
In terms of wage/income gap, the demographic groups most similar to Immigrants from Senegal are Immigrants from Bangladesh (20.9%, a difference of 0.21%), Vietnamese (21.0%, a difference of 0.49%), Inupiat (20.8%, a difference of 0.62%), Immigrants from Yemen (21.1%, a difference of 0.73%), and Immigrants from Bahamas (21.1%, a difference of 0.74%).
| Demographics | Rating | Rank | Wage/Income Gap |
| Immigrants | Liberia | 100.0 /100 | #22 | Exceptional 20.6% |
| Immigrants | Dominican Republic | 100.0 /100 | #23 | Exceptional 20.6% |
| Dominicans | 100.0 /100 | #24 | Exceptional 20.6% |
| Senegalese | 100.0 /100 | #25 | Exceptional 20.7% |
| Pueblo | 100.0 /100 | #26 | Exceptional 20.7% |
| Immigrants | Armenia | 100.0 /100 | #27 | Exceptional 20.7% |
| Inupiat | 100.0 /100 | #28 | Exceptional 20.8% |
| Immigrants | Senegal | 100.0 /100 | #29 | Exceptional 20.9% |
| Immigrants | Bangladesh | 100.0 /100 | #30 | Exceptional 20.9% |
| Vietnamese | 100.0 /100 | #31 | Exceptional 21.0% |
| Immigrants | Yemen | 100.0 /100 | #32 | Exceptional 21.1% |
| Immigrants | Bahamas | 100.0 /100 | #33 | Exceptional 21.1% |
| Pima | 100.0 /100 | #34 | Exceptional 21.1% |
| Somalis | 100.0 /100 | #35 | Exceptional 21.2% |
| Belizeans | 100.0 /100 | #36 | Exceptional 21.2% |