American vs Hawaiian Unemployment Among Women with Children Ages 6 to 17 years
COMPARE
American
Hawaiian
Unemployment Among Women with Children Ages 6 to 17 years
Unemployment Among Women with Children Ages 6 to 17 years Comparison
Americans
Hawaiians
10.4%
UNEMPLOYMENT AMONG WOMEN WITH CHILDREN AGES 6 TO 17 YEARS
0.0/ 100
METRIC RATING
313th/ 347
METRIC RANK
8.1%
UNEMPLOYMENT AMONG WOMEN WITH CHILDREN AGES 6 TO 17 YEARS
100.0/ 100
METRIC RATING
50th/ 347
METRIC RANK
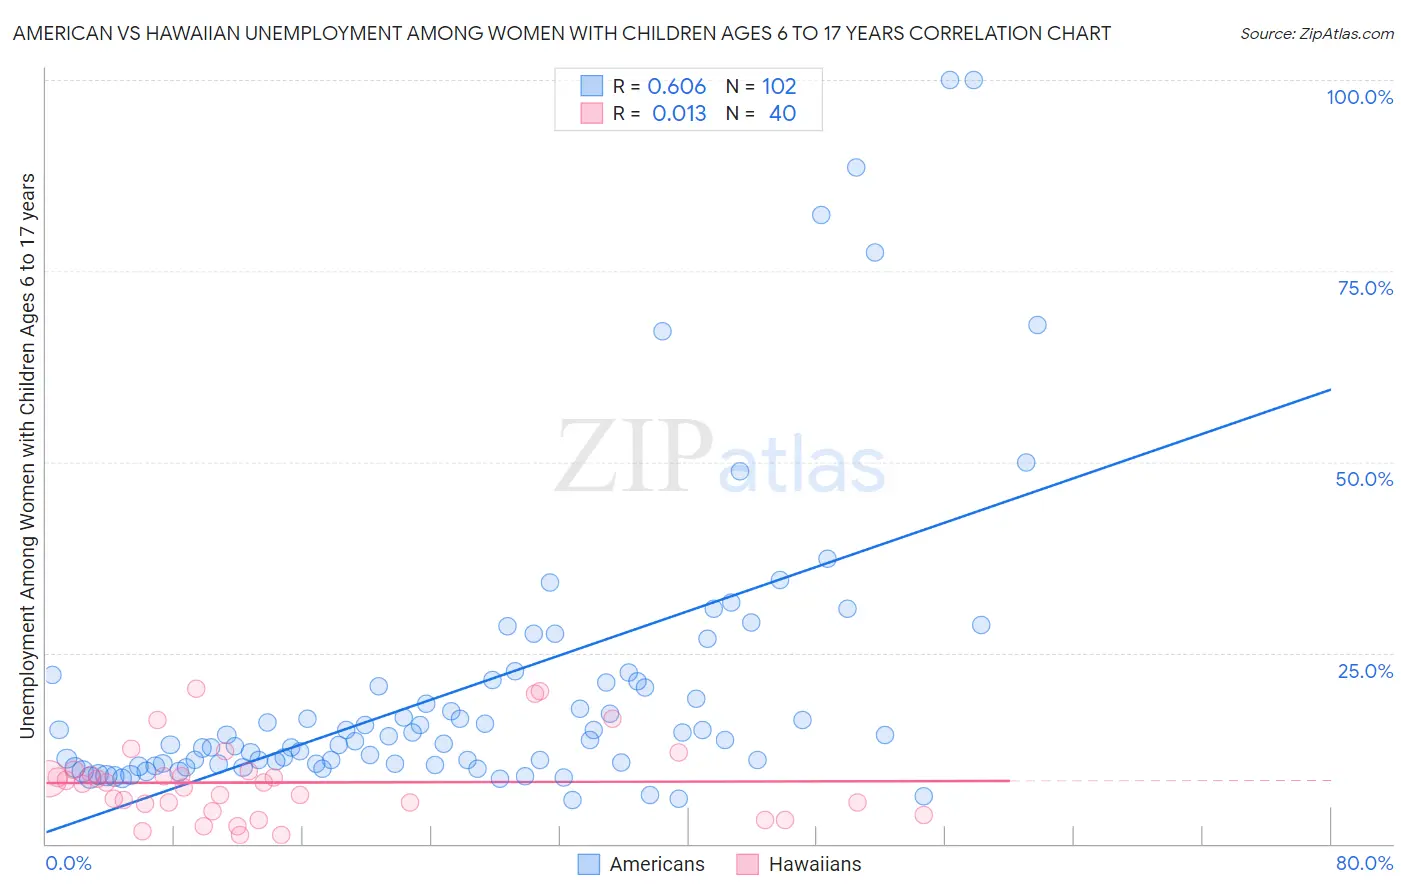
American vs Hawaiian Unemployment Among Women with Children Ages 6 to 17 years Correlation Chart
The statistical analysis conducted on geographies consisting of 361,036,029 people shows a significant positive correlation between the proportion of Americans and unemployment rate among women with children between the ages 6 and 17 in the United States with a correlation coefficient (R) of 0.606 and weighted average of 10.4%. Similarly, the statistical analysis conducted on geographies consisting of 248,677,596 people shows no correlation between the proportion of Hawaiians and unemployment rate among women with children between the ages 6 and 17 in the United States with a correlation coefficient (R) of 0.013 and weighted average of 8.1%, a difference of 28.7%.
Unemployment Among Women with Children Ages 6 to 17 years Correlation Summary
| Measurement | American | Hawaiian |
| Minimum | 5.8% | 1.1% |
| Maximum | 100.0% | 20.3% |
| Range | 94.2% | 19.2% |
| Mean | 20.6% | 8.0% |
| Median | 13.9% | 7.9% |
| Interquartile 25% (IQ1) | 10.4% | 4.8% |
| Interquartile 75% (IQ3) | 21.3% | 9.3% |
| Interquartile Range (IQR) | 10.8% | 4.5% |
| Standard Deviation (Sample) | 19.3% | 5.0% |
| Standard Deviation (Population) | 19.2% | 4.9% |
Similar Demographics by Unemployment Among Women with Children Ages 6 to 17 years
Demographics Similar to Americans by Unemployment Among Women with Children Ages 6 to 17 years
In terms of unemployment among women with children ages 6 to 17 years, the demographic groups most similar to Americans are Immigrants from Cabo Verde (10.4%, a difference of 0.050%), Bahamian (10.4%, a difference of 0.080%), African (10.4%, a difference of 0.18%), Immigrants from Dominica (10.5%, a difference of 0.83%), and Bermudan (10.5%, a difference of 0.94%).
| Demographics | Rating | Rank | Unemployment Among Women with Children Ages 6 to 17 years |
| Paraguayans | 0.0 /100 | #306 | Tragic 10.2% |
| Immigrants | Senegal | 0.0 /100 | #307 | Tragic 10.2% |
| Dutch West Indians | 0.0 /100 | #308 | Tragic 10.2% |
| French Canadians | 0.0 /100 | #309 | Tragic 10.3% |
| Alaska Natives | 0.0 /100 | #310 | Tragic 10.3% |
| Immigrants | Liberia | 0.0 /100 | #311 | Tragic 10.3% |
| Africans | 0.0 /100 | #312 | Tragic 10.4% |
| Americans | 0.0 /100 | #313 | Tragic 10.4% |
| Immigrants | Cabo Verde | 0.0 /100 | #314 | Tragic 10.4% |
| Bahamians | 0.0 /100 | #315 | Tragic 10.4% |
| Immigrants | Dominica | 0.0 /100 | #316 | Tragic 10.5% |
| Bermudans | 0.0 /100 | #317 | Tragic 10.5% |
| Delaware | 0.0 /100 | #318 | Tragic 10.5% |
| Immigrants | Uganda | 0.0 /100 | #319 | Tragic 10.7% |
| Apache | 0.0 /100 | #320 | Tragic 10.7% |
Demographics Similar to Hawaiians by Unemployment Among Women with Children Ages 6 to 17 years
In terms of unemployment among women with children ages 6 to 17 years, the demographic groups most similar to Hawaiians are Immigrants from Oceania (8.1%, a difference of 0.11%), Immigrants from Asia (8.1%, a difference of 0.16%), Immigrants from Sudan (8.1%, a difference of 0.18%), Immigrants from Switzerland (8.1%, a difference of 0.29%), and Icelander (8.1%, a difference of 0.33%).
| Demographics | Rating | Rank | Unemployment Among Women with Children Ages 6 to 17 years |
| Bhutanese | 100.0 /100 | #43 | Exceptional 8.1% |
| Immigrants | Sweden | 100.0 /100 | #44 | Exceptional 8.1% |
| Immigrants | Bulgaria | 100.0 /100 | #45 | Exceptional 8.1% |
| Icelanders | 100.0 /100 | #46 | Exceptional 8.1% |
| Immigrants | Switzerland | 100.0 /100 | #47 | Exceptional 8.1% |
| Immigrants | Asia | 100.0 /100 | #48 | Exceptional 8.1% |
| Immigrants | Oceania | 100.0 /100 | #49 | Exceptional 8.1% |
| Hawaiians | 100.0 /100 | #50 | Exceptional 8.1% |
| Immigrants | Sudan | 100.0 /100 | #51 | Exceptional 8.1% |
| Immigrants | Iraq | 100.0 /100 | #52 | Exceptional 8.1% |
| Danes | 100.0 /100 | #53 | Exceptional 8.1% |
| Immigrants | Armenia | 100.0 /100 | #54 | Exceptional 8.2% |
| Immigrants | Japan | 100.0 /100 | #55 | Exceptional 8.2% |
| Immigrants | Bosnia and Herzegovina | 100.0 /100 | #56 | Exceptional 8.2% |
| Immigrants | Laos | 100.0 /100 | #57 | Exceptional 8.2% |