African vs Immigrants from Hong Kong Median Household Income
COMPARE
African
Immigrants from Hong Kong
Median Household Income
Median Household Income Comparison
Africans
Immigrants from Hong Kong
$72,650
MEDIAN HOUSEHOLD INCOME
0.0/ 100
METRIC RATING
303rd/ 347
METRIC RANK
$111,519
MEDIAN HOUSEHOLD INCOME
100.0/ 100
METRIC RATING
4th/ 347
METRIC RANK
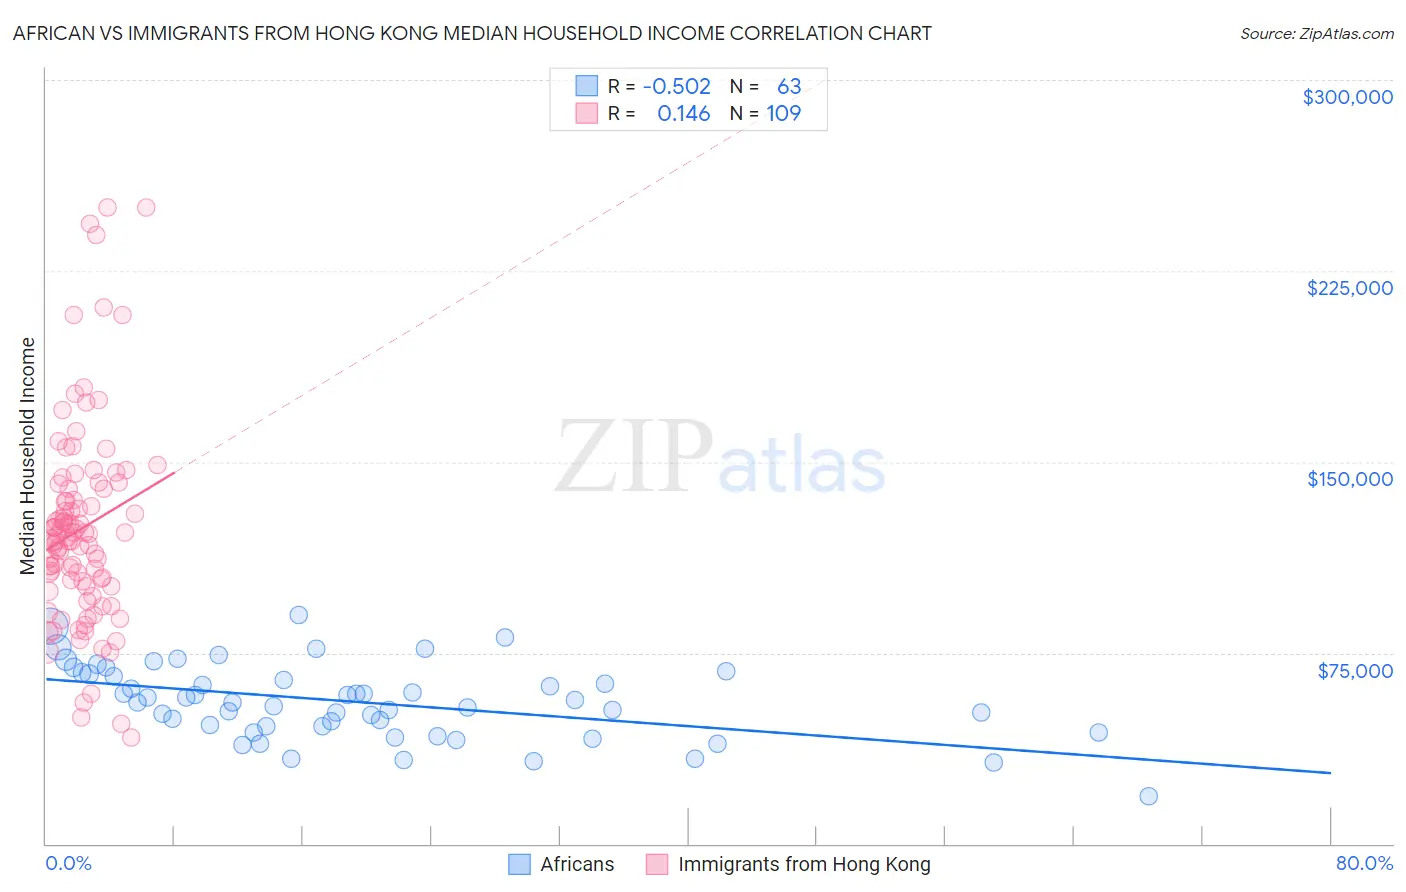
African vs Immigrants from Hong Kong Median Household Income Correlation Chart
The statistical analysis conducted on geographies consisting of 469,417,783 people shows a substantial negative correlation between the proportion of Africans and median household income in the United States with a correlation coefficient (R) of -0.502 and weighted average of $72,650. Similarly, the statistical analysis conducted on geographies consisting of 253,858,060 people shows a poor positive correlation between the proportion of Immigrants from Hong Kong and median household income in the United States with a correlation coefficient (R) of 0.146 and weighted average of $111,519, a difference of 53.5%.
Median Household Income Correlation Summary
| Measurement | African | Immigrants from Hong Kong |
| Minimum | $18,750 | $41,563 |
| Maximum | $89,652 | $250,001 |
| Range | $70,902 | $208,438 |
| Mean | $55,711 | $123,651 |
| Median | $55,621 | $120,226 |
| Interquartile 25% (IQ1) | $45,960 | $102,101 |
| Interquartile 75% (IQ3) | $66,633 | $139,539 |
| Interquartile Range (IQR) | $20,673 | $37,437 |
| Standard Deviation (Sample) | $14,453 | $39,253 |
| Standard Deviation (Population) | $14,338 | $39,072 |
Similar Demographics by Median Household Income
Demographics Similar to Africans by Median Household Income
In terms of median household income, the demographic groups most similar to Africans are Shoshone ($72,660, a difference of 0.010%), Cherokee ($72,682, a difference of 0.040%), Immigrants from Haiti ($72,599, a difference of 0.070%), Honduran ($72,588, a difference of 0.090%), and Potawatomi ($72,576, a difference of 0.10%).
| Demographics | Rating | Rank | Median Household Income |
| Haitians | 0.1 /100 | #296 | Tragic $73,306 |
| Immigrants | Mexico | 0.0 /100 | #297 | Tragic $73,160 |
| Paiute | 0.0 /100 | #298 | Tragic $72,959 |
| Indonesians | 0.0 /100 | #299 | Tragic $72,856 |
| Immigrants | Dominica | 0.0 /100 | #300 | Tragic $72,760 |
| Cherokee | 0.0 /100 | #301 | Tragic $72,682 |
| Shoshone | 0.0 /100 | #302 | Tragic $72,660 |
| Africans | 0.0 /100 | #303 | Tragic $72,650 |
| Immigrants | Haiti | 0.0 /100 | #304 | Tragic $72,599 |
| Hondurans | 0.0 /100 | #305 | Tragic $72,588 |
| Potawatomi | 0.0 /100 | #306 | Tragic $72,576 |
| Ute | 0.0 /100 | #307 | Tragic $72,402 |
| Yakama | 0.0 /100 | #308 | Tragic $72,225 |
| Immigrants | Caribbean | 0.0 /100 | #309 | Tragic $71,860 |
| U.S. Virgin Islanders | 0.0 /100 | #310 | Tragic $71,853 |
Demographics Similar to Immigrants from Hong Kong by Median Household Income
In terms of median household income, the demographic groups most similar to Immigrants from Hong Kong are Thai ($110,648, a difference of 0.79%), Immigrants from Singapore ($110,428, a difference of 0.99%), Immigrants from India ($113,009, a difference of 1.3%), Iranian ($109,835, a difference of 1.5%), and Immigrants from Iran ($108,055, a difference of 3.2%).
| Demographics | Rating | Rank | Median Household Income |
| Immigrants | Taiwan | 100.0 /100 | #1 | Exceptional $116,460 |
| Filipinos | 100.0 /100 | #2 | Exceptional $115,509 |
| Immigrants | India | 100.0 /100 | #3 | Exceptional $113,009 |
| Immigrants | Hong Kong | 100.0 /100 | #4 | Exceptional $111,519 |
| Thais | 100.0 /100 | #5 | Exceptional $110,648 |
| Immigrants | Singapore | 100.0 /100 | #6 | Exceptional $110,428 |
| Iranians | 100.0 /100 | #7 | Exceptional $109,835 |
| Immigrants | Iran | 100.0 /100 | #8 | Exceptional $108,055 |
| Okinawans | 100.0 /100 | #9 | Exceptional $106,624 |
| Immigrants | South Central Asia | 100.0 /100 | #10 | Exceptional $106,057 |
| Immigrants | China | 100.0 /100 | #11 | Exceptional $105,335 |
| Indians (Asian) | 100.0 /100 | #12 | Exceptional $105,262 |
| Immigrants | Eastern Asia | 100.0 /100 | #13 | Exceptional $104,796 |
| Immigrants | Ireland | 100.0 /100 | #14 | Exceptional $104,692 |
| Immigrants | Israel | 100.0 /100 | #15 | Exceptional $104,090 |