Native/Alaskan vs Immigrants from Hong Kong Median Household Income
COMPARE
Native/Alaskan
Immigrants from Hong Kong
Median Household Income
Median Household Income Comparison
Natives/Alaskans
Immigrants from Hong Kong
$67,879
MEDIAN HOUSEHOLD INCOME
0.0/ 100
METRIC RATING
331st/ 347
METRIC RANK
$111,519
MEDIAN HOUSEHOLD INCOME
100.0/ 100
METRIC RATING
4th/ 347
METRIC RANK
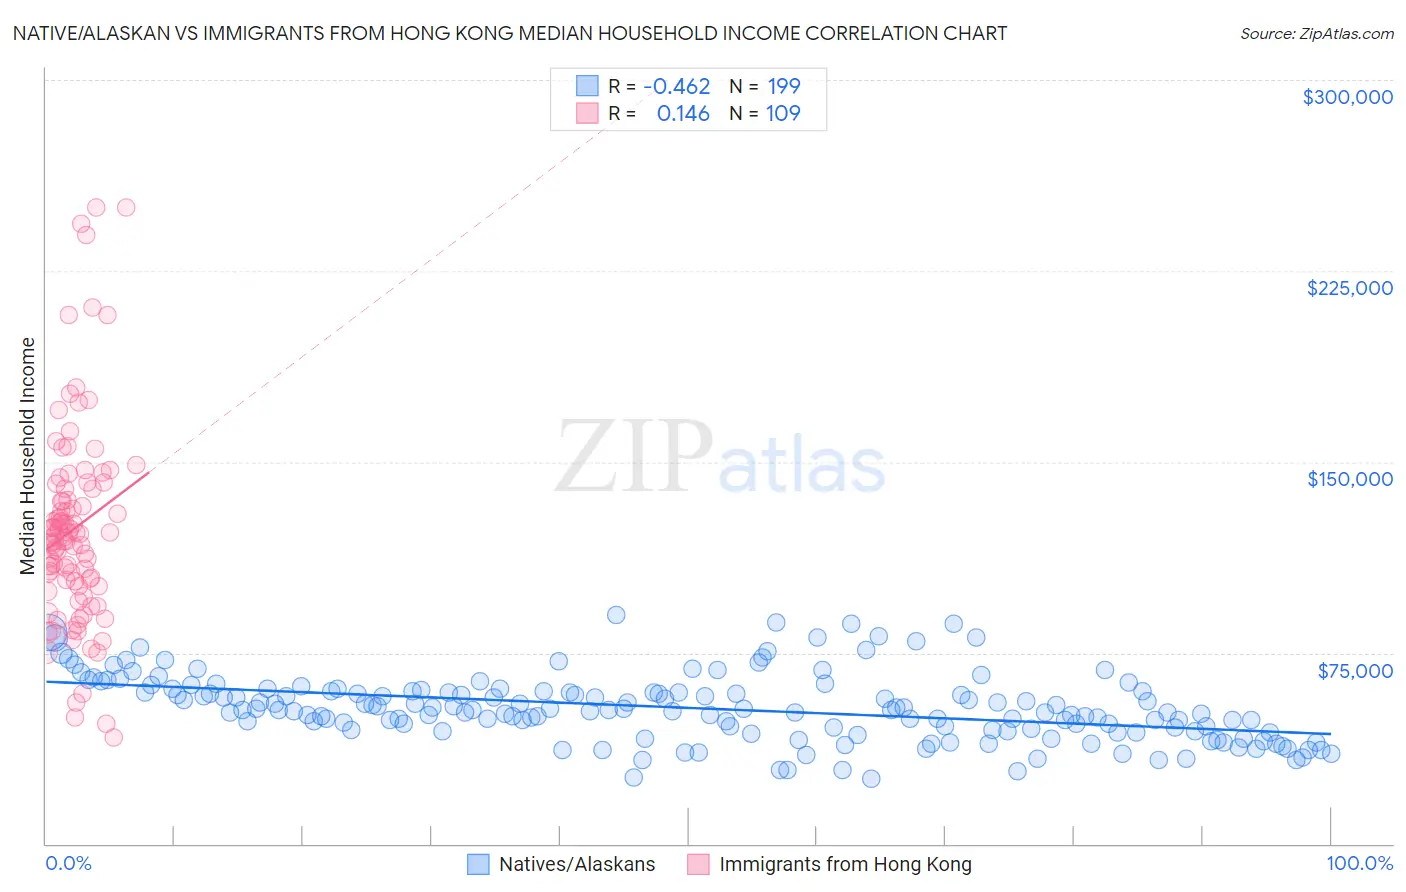
Native/Alaskan vs Immigrants from Hong Kong Median Household Income Correlation Chart
The statistical analysis conducted on geographies consisting of 512,383,553 people shows a moderate negative correlation between the proportion of Natives/Alaskans and median household income in the United States with a correlation coefficient (R) of -0.462 and weighted average of $67,879. Similarly, the statistical analysis conducted on geographies consisting of 253,858,060 people shows a poor positive correlation between the proportion of Immigrants from Hong Kong and median household income in the United States with a correlation coefficient (R) of 0.146 and weighted average of $111,519, a difference of 64.3%.
Median Household Income Correlation Summary
| Measurement | Native/Alaskan | Immigrants from Hong Kong |
| Minimum | $25,291 | $41,563 |
| Maximum | $89,884 | $250,001 |
| Range | $64,593 | $208,438 |
| Mean | $53,343 | $123,651 |
| Median | $52,617 | $120,226 |
| Interquartile 25% (IQ1) | $44,793 | $102,101 |
| Interquartile 75% (IQ3) | $60,078 | $139,539 |
| Interquartile Range (IQR) | $15,285 | $37,437 |
| Standard Deviation (Sample) | $12,918 | $39,253 |
| Standard Deviation (Population) | $12,886 | $39,072 |
Similar Demographics by Median Household Income
Demographics Similar to Natives/Alaskans by Median Household Income
In terms of median household income, the demographic groups most similar to Natives/Alaskans are Arapaho ($67,965, a difference of 0.13%), Sioux ($67,792, a difference of 0.13%), Creek ($67,715, a difference of 0.24%), Black/African American ($67,573, a difference of 0.45%), and Dutch West Indian ($68,412, a difference of 0.79%).
| Demographics | Rating | Rank | Median Household Income |
| Yup'ik | 0.0 /100 | #324 | Tragic $69,695 |
| Seminole | 0.0 /100 | #325 | Tragic $69,420 |
| Yuman | 0.0 /100 | #326 | Tragic $68,743 |
| Immigrants | Cuba | 0.0 /100 | #327 | Tragic $68,461 |
| Menominee | 0.0 /100 | #328 | Tragic $68,423 |
| Dutch West Indians | 0.0 /100 | #329 | Tragic $68,412 |
| Arapaho | 0.0 /100 | #330 | Tragic $67,965 |
| Natives/Alaskans | 0.0 /100 | #331 | Tragic $67,879 |
| Sioux | 0.0 /100 | #332 | Tragic $67,792 |
| Creek | 0.0 /100 | #333 | Tragic $67,715 |
| Blacks/African Americans | 0.0 /100 | #334 | Tragic $67,573 |
| Cheyenne | 0.0 /100 | #335 | Tragic $66,974 |
| Immigrants | Congo | 0.0 /100 | #336 | Tragic $66,768 |
| Kiowa | 0.0 /100 | #337 | Tragic $65,914 |
| Immigrants | Yemen | 0.0 /100 | #338 | Tragic $65,194 |
Demographics Similar to Immigrants from Hong Kong by Median Household Income
In terms of median household income, the demographic groups most similar to Immigrants from Hong Kong are Thai ($110,648, a difference of 0.79%), Immigrants from Singapore ($110,428, a difference of 0.99%), Immigrants from India ($113,009, a difference of 1.3%), Iranian ($109,835, a difference of 1.5%), and Immigrants from Iran ($108,055, a difference of 3.2%).
| Demographics | Rating | Rank | Median Household Income |
| Immigrants | Taiwan | 100.0 /100 | #1 | Exceptional $116,460 |
| Filipinos | 100.0 /100 | #2 | Exceptional $115,509 |
| Immigrants | India | 100.0 /100 | #3 | Exceptional $113,009 |
| Immigrants | Hong Kong | 100.0 /100 | #4 | Exceptional $111,519 |
| Thais | 100.0 /100 | #5 | Exceptional $110,648 |
| Immigrants | Singapore | 100.0 /100 | #6 | Exceptional $110,428 |
| Iranians | 100.0 /100 | #7 | Exceptional $109,835 |
| Immigrants | Iran | 100.0 /100 | #8 | Exceptional $108,055 |
| Okinawans | 100.0 /100 | #9 | Exceptional $106,624 |
| Immigrants | South Central Asia | 100.0 /100 | #10 | Exceptional $106,057 |
| Immigrants | China | 100.0 /100 | #11 | Exceptional $105,335 |
| Indians (Asian) | 100.0 /100 | #12 | Exceptional $105,262 |
| Immigrants | Eastern Asia | 100.0 /100 | #13 | Exceptional $104,796 |
| Immigrants | Ireland | 100.0 /100 | #14 | Exceptional $104,692 |
| Immigrants | Israel | 100.0 /100 | #15 | Exceptional $104,090 |