African vs Immigrants from Hong Kong Male Unemployment
COMPARE
African
Immigrants from Hong Kong
Male Unemployment
Male Unemployment Comparison
Africans
Immigrants from Hong Kong
6.3%
MALE UNEMPLOYMENT
0.0/ 100
METRIC RATING
286th/ 347
METRIC RANK
5.2%
MALE UNEMPLOYMENT
65.7/ 100
METRIC RATING
163rd/ 347
METRIC RANK
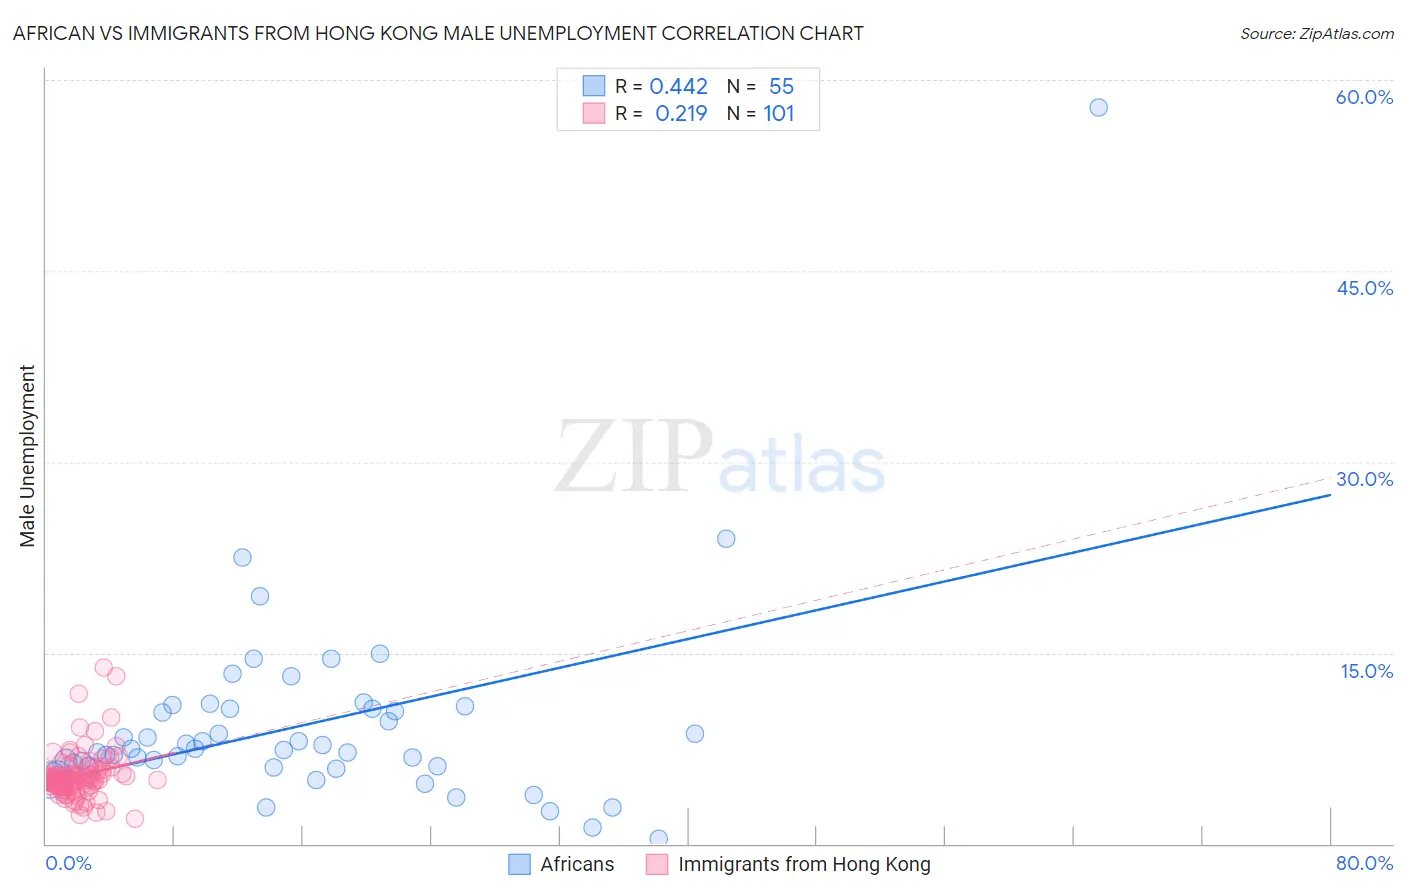
African vs Immigrants from Hong Kong Male Unemployment Correlation Chart
The statistical analysis conducted on geographies consisting of 467,193,011 people shows a moderate positive correlation between the proportion of Africans and unemployment rate among males in the United States with a correlation coefficient (R) of 0.442 and weighted average of 6.3%. Similarly, the statistical analysis conducted on geographies consisting of 253,631,392 people shows a weak positive correlation between the proportion of Immigrants from Hong Kong and unemployment rate among males in the United States with a correlation coefficient (R) of 0.219 and weighted average of 5.2%, a difference of 19.3%.
Male Unemployment Correlation Summary
| Measurement | African | Immigrants from Hong Kong |
| Minimum | 0.40% | 2.0% |
| Maximum | 57.8% | 13.8% |
| Range | 57.4% | 11.8% |
| Mean | 9.3% | 5.3% |
| Median | 7.5% | 5.0% |
| Interquartile 25% (IQ1) | 6.1% | 4.5% |
| Interquartile 75% (IQ3) | 10.6% | 5.5% |
| Interquartile Range (IQR) | 4.5% | 0.99% |
| Standard Deviation (Sample) | 8.1% | 1.9% |
| Standard Deviation (Population) | 8.0% | 1.9% |
Similar Demographics by Male Unemployment
Demographics Similar to Africans by Male Unemployment
In terms of male unemployment, the demographic groups most similar to Africans are Central American Indian (6.3%, a difference of 0.29%), Immigrants from Senegal (6.3%, a difference of 0.33%), Immigrants from Ecuador (6.2%, a difference of 0.43%), Spanish American Indian (6.2%, a difference of 0.45%), and Immigrants from Caribbean (6.3%, a difference of 0.45%).
| Demographics | Rating | Rank | Male Unemployment |
| Ghanaians | 0.0 /100 | #279 | Tragic 6.1% |
| Immigrants | Ghana | 0.0 /100 | #280 | Tragic 6.2% |
| Sierra Leoneans | 0.0 /100 | #281 | Tragic 6.2% |
| Ecuadorians | 0.0 /100 | #282 | Tragic 6.2% |
| Immigrants | Western Africa | 0.0 /100 | #283 | Tragic 6.2% |
| Spanish American Indians | 0.0 /100 | #284 | Tragic 6.2% |
| Immigrants | Ecuador | 0.0 /100 | #285 | Tragic 6.2% |
| Africans | 0.0 /100 | #286 | Tragic 6.3% |
| Central American Indians | 0.0 /100 | #287 | Tragic 6.3% |
| Immigrants | Senegal | 0.0 /100 | #288 | Tragic 6.3% |
| Immigrants | Caribbean | 0.0 /100 | #289 | Tragic 6.3% |
| U.S. Virgin Islanders | 0.0 /100 | #290 | Tragic 6.4% |
| Immigrants | Azores | 0.0 /100 | #291 | Tragic 6.4% |
| Nepalese | 0.0 /100 | #292 | Tragic 6.4% |
| Haitians | 0.0 /100 | #293 | Tragic 6.4% |
Demographics Similar to Immigrants from Hong Kong by Male Unemployment
In terms of male unemployment, the demographic groups most similar to Immigrants from Hong Kong are Immigrants from Egypt (5.2%, a difference of 0.010%), Afghan (5.3%, a difference of 0.24%), South American (5.3%, a difference of 0.32%), Immigrants from China (5.2%, a difference of 0.34%), and Immigrants from Morocco (5.3%, a difference of 0.35%).
| Demographics | Rating | Rank | Male Unemployment |
| Americans | 72.7 /100 | #156 | Good 5.2% |
| Immigrants | Northern Africa | 72.3 /100 | #157 | Good 5.2% |
| Immigrants | Indonesia | 71.5 /100 | #158 | Good 5.2% |
| Indonesians | 71.2 /100 | #159 | Good 5.2% |
| Immigrants | Norway | 71.0 /100 | #160 | Good 5.2% |
| Immigrants | China | 70.6 /100 | #161 | Good 5.2% |
| Immigrants | Egypt | 65.9 /100 | #162 | Good 5.2% |
| Immigrants | Hong Kong | 65.7 /100 | #163 | Good 5.2% |
| Afghans | 62.0 /100 | #164 | Good 5.3% |
| South Americans | 60.6 /100 | #165 | Good 5.3% |
| Immigrants | Morocco | 60.2 /100 | #166 | Good 5.3% |
| Immigrants | Vietnam | 58.1 /100 | #167 | Average 5.3% |
| Immigrants | Ireland | 57.7 /100 | #168 | Average 5.3% |
| Immigrants | Congo | 57.4 /100 | #169 | Average 5.3% |
| Immigrants | Eastern Europe | 54.1 /100 | #170 | Average 5.3% |