Immigrants from Japan vs Immigrants from Hong Kong Median Household Income
COMPARE
Immigrants from Japan
Immigrants from Hong Kong
Median Household Income
Median Household Income Comparison
Immigrants from Japan
Immigrants from Hong Kong
$100,711
MEDIAN HOUSEHOLD INCOME
100.0/ 100
METRIC RATING
24th/ 347
METRIC RANK
$111,519
MEDIAN HOUSEHOLD INCOME
100.0/ 100
METRIC RATING
4th/ 347
METRIC RANK
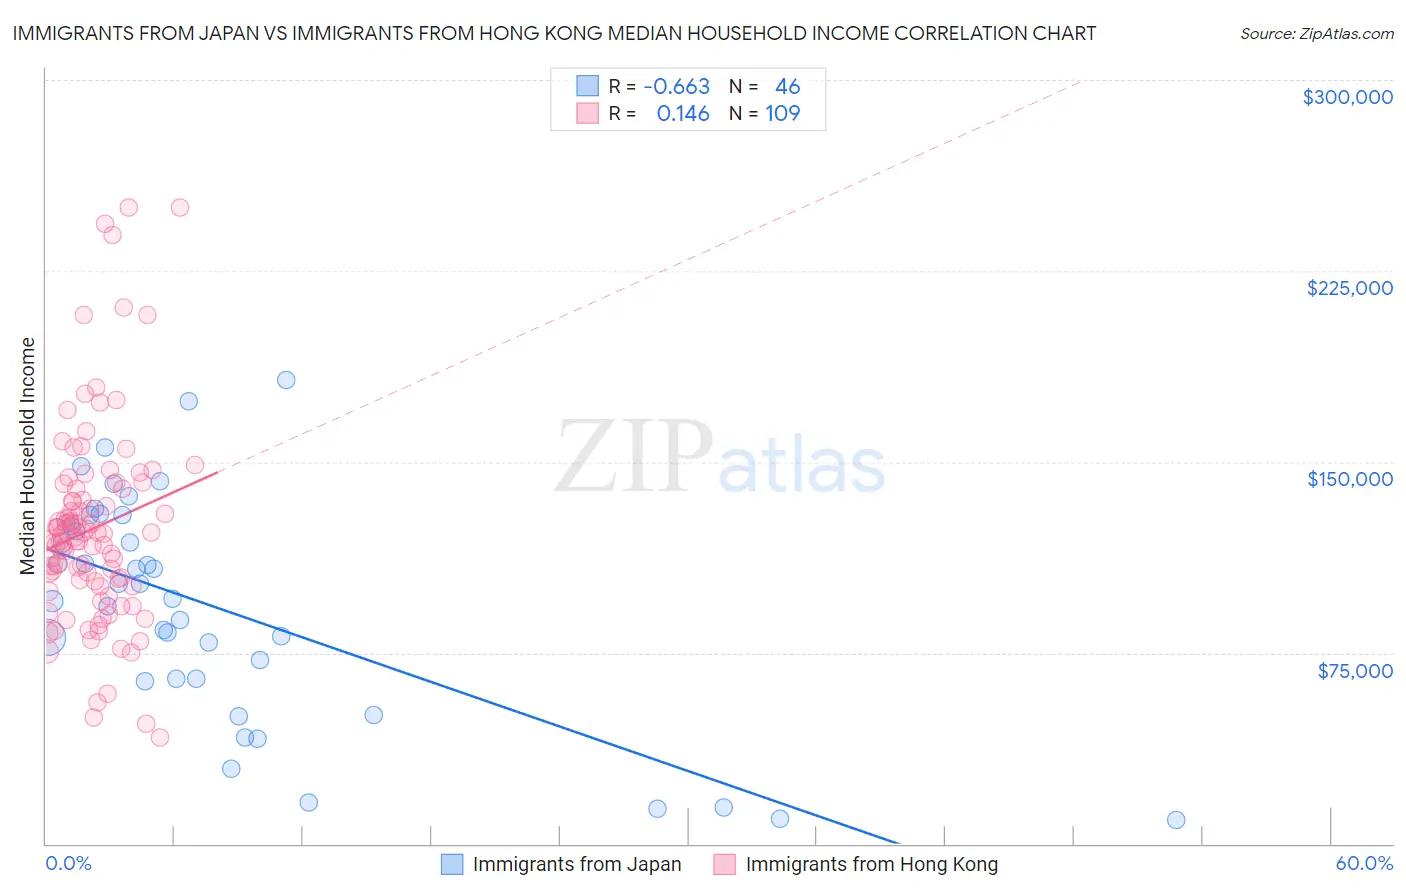
Immigrants from Japan vs Immigrants from Hong Kong Median Household Income Correlation Chart
The statistical analysis conducted on geographies consisting of 339,951,010 people shows a significant negative correlation between the proportion of Immigrants from Japan and median household income in the United States with a correlation coefficient (R) of -0.663 and weighted average of $100,711. Similarly, the statistical analysis conducted on geographies consisting of 253,858,060 people shows a poor positive correlation between the proportion of Immigrants from Hong Kong and median household income in the United States with a correlation coefficient (R) of 0.146 and weighted average of $111,519, a difference of 10.7%.
Median Household Income Correlation Summary
| Measurement | Immigrants from Japan | Immigrants from Hong Kong |
| Minimum | $9,145 | $41,563 |
| Maximum | $182,188 | $250,001 |
| Range | $173,043 | $208,438 |
| Mean | $93,083 | $123,651 |
| Median | $99,144 | $120,226 |
| Interquartile 25% (IQ1) | $64,688 | $102,101 |
| Interquartile 75% (IQ3) | $125,805 | $139,539 |
| Interquartile Range (IQR) | $61,117 | $37,437 |
| Standard Deviation (Sample) | $44,275 | $39,253 |
| Standard Deviation (Population) | $43,791 | $39,072 |
Demographics Similar to Immigrants from Japan and Immigrants from Hong Kong by Median Household Income
In terms of median household income, the demographic groups most similar to Immigrants from Japan are Immigrants from Bolivia ($101,394, a difference of 0.68%), Asian ($101,681, a difference of 0.96%), Eastern European ($101,781, a difference of 1.1%), Bolivian ($102,195, a difference of 1.5%), and Immigrants from Australia ($102,562, a difference of 1.8%). Similarly, the demographic groups most similar to Immigrants from Hong Kong are Thai ($110,648, a difference of 0.79%), Immigrants from Singapore ($110,428, a difference of 0.99%), Iranian ($109,835, a difference of 1.5%), Immigrants from Iran ($108,055, a difference of 3.2%), and Okinawan ($106,624, a difference of 4.6%).
| Demographics | Rating | Rank | Median Household Income |
| Immigrants | Hong Kong | 100.0 /100 | #4 | Exceptional $111,519 |
| Thais | 100.0 /100 | #5 | Exceptional $110,648 |
| Immigrants | Singapore | 100.0 /100 | #6 | Exceptional $110,428 |
| Iranians | 100.0 /100 | #7 | Exceptional $109,835 |
| Immigrants | Iran | 100.0 /100 | #8 | Exceptional $108,055 |
| Okinawans | 100.0 /100 | #9 | Exceptional $106,624 |
| Immigrants | South Central Asia | 100.0 /100 | #10 | Exceptional $106,057 |
| Immigrants | China | 100.0 /100 | #11 | Exceptional $105,335 |
| Indians (Asian) | 100.0 /100 | #12 | Exceptional $105,262 |
| Immigrants | Eastern Asia | 100.0 /100 | #13 | Exceptional $104,796 |
| Immigrants | Ireland | 100.0 /100 | #14 | Exceptional $104,692 |
| Immigrants | Israel | 100.0 /100 | #15 | Exceptional $104,090 |
| Burmese | 100.0 /100 | #16 | Exceptional $103,145 |
| Immigrants | Korea | 100.0 /100 | #17 | Exceptional $102,962 |
| Cypriots | 100.0 /100 | #18 | Exceptional $102,843 |
| Immigrants | Australia | 100.0 /100 | #19 | Exceptional $102,562 |
| Bolivians | 100.0 /100 | #20 | Exceptional $102,195 |
| Eastern Europeans | 100.0 /100 | #21 | Exceptional $101,781 |
| Asians | 100.0 /100 | #22 | Exceptional $101,681 |
| Immigrants | Bolivia | 100.0 /100 | #23 | Exceptional $101,394 |
| Immigrants | Japan | 100.0 /100 | #24 | Exceptional $100,711 |