African vs Immigrants from Hong Kong Self-Care Disability
COMPARE
African
Immigrants from Hong Kong
Self-Care Disability
Self-Care Disability Comparison
Africans
Immigrants from Hong Kong
2.7%
SELF-CARE DISABILITY
0.0/ 100
METRIC RATING
289th/ 347
METRIC RANK
2.4%
SELF-CARE DISABILITY
93.1/ 100
METRIC RATING
115th/ 347
METRIC RANK
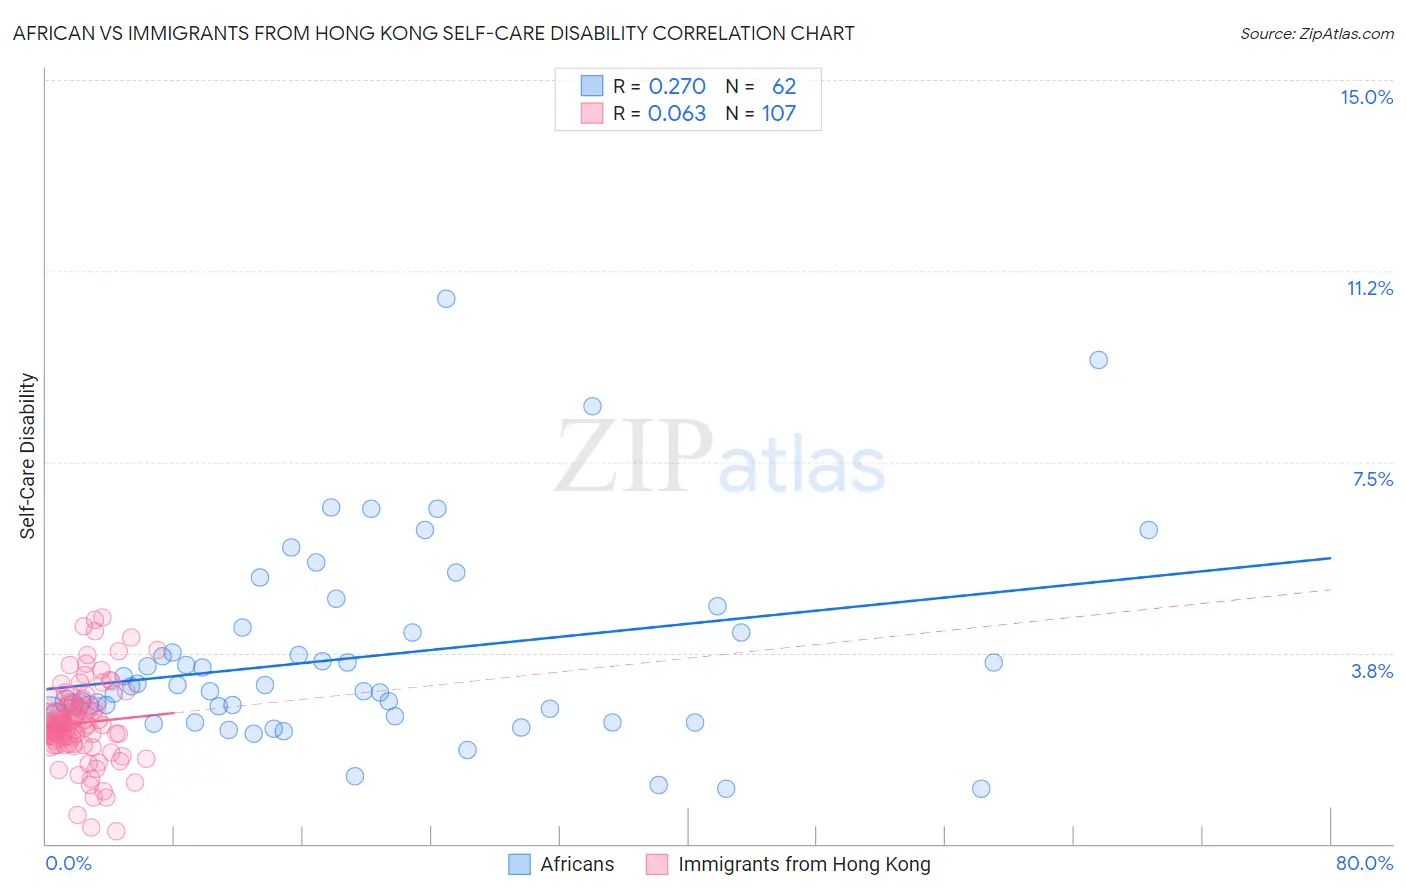
African vs Immigrants from Hong Kong Self-Care Disability Correlation Chart
The statistical analysis conducted on geographies consisting of 469,231,301 people shows a weak positive correlation between the proportion of Africans and percentage of population with self-care disability in the United States with a correlation coefficient (R) of 0.270 and weighted average of 2.7%. Similarly, the statistical analysis conducted on geographies consisting of 253,791,593 people shows a slight positive correlation between the proportion of Immigrants from Hong Kong and percentage of population with self-care disability in the United States with a correlation coefficient (R) of 0.063 and weighted average of 2.4%, a difference of 14.1%.
Self-Care Disability Correlation Summary
| Measurement | African | Immigrants from Hong Kong |
| Minimum | 1.1% | 0.25% |
| Maximum | 10.7% | 4.4% |
| Range | 9.6% | 4.2% |
| Mean | 3.7% | 2.4% |
| Median | 3.0% | 2.3% |
| Interquartile 25% (IQ1) | 2.5% | 2.0% |
| Interquartile 75% (IQ3) | 4.2% | 2.7% |
| Interquartile Range (IQR) | 1.6% | 0.75% |
| Standard Deviation (Sample) | 1.9% | 0.79% |
| Standard Deviation (Population) | 1.9% | 0.78% |
Similar Demographics by Self-Care Disability
Demographics Similar to Africans by Self-Care Disability
In terms of self-care disability, the demographic groups most similar to Africans are Immigrants from Barbados (2.7%, a difference of 0.10%), Immigrants from Jamaica (2.7%, a difference of 0.14%), Cuban (2.7%, a difference of 0.15%), Guyanese (2.7%, a difference of 0.41%), and French American Indian (2.7%, a difference of 0.47%).
| Demographics | Rating | Rank | Self-Care Disability |
| Apache | 0.0 /100 | #282 | Tragic 2.7% |
| Delaware | 0.0 /100 | #283 | Tragic 2.7% |
| Fijians | 0.0 /100 | #284 | Tragic 2.7% |
| Jamaicans | 0.0 /100 | #285 | Tragic 2.7% |
| French American Indians | 0.0 /100 | #286 | Tragic 2.7% |
| Immigrants | Jamaica | 0.0 /100 | #287 | Tragic 2.7% |
| Immigrants | Barbados | 0.0 /100 | #288 | Tragic 2.7% |
| Africans | 0.0 /100 | #289 | Tragic 2.7% |
| Cubans | 0.0 /100 | #290 | Tragic 2.7% |
| Guyanese | 0.0 /100 | #291 | Tragic 2.7% |
| Central American Indians | 0.0 /100 | #292 | Tragic 2.7% |
| Belizeans | 0.0 /100 | #293 | Tragic 2.7% |
| Blackfeet | 0.0 /100 | #294 | Tragic 2.7% |
| Barbadians | 0.0 /100 | #295 | Tragic 2.7% |
| Immigrants | Portugal | 0.0 /100 | #296 | Tragic 2.8% |
Demographics Similar to Immigrants from Hong Kong by Self-Care Disability
In terms of self-care disability, the demographic groups most similar to Immigrants from Hong Kong are Immigrants from North Macedonia (2.4%, a difference of 0.0%), South American (2.4%, a difference of 0.010%), Northern European (2.4%, a difference of 0.050%), Scandinavian (2.4%, a difference of 0.070%), and Serbian (2.4%, a difference of 0.090%).
| Demographics | Rating | Rank | Self-Care Disability |
| Greeks | 94.1 /100 | #108 | Exceptional 2.4% |
| Slovenes | 94.1 /100 | #109 | Exceptional 2.4% |
| Immigrants | Africa | 93.7 /100 | #110 | Exceptional 2.4% |
| Serbians | 93.6 /100 | #111 | Exceptional 2.4% |
| Scandinavians | 93.5 /100 | #112 | Exceptional 2.4% |
| South Americans | 93.2 /100 | #113 | Exceptional 2.4% |
| Immigrants | North Macedonia | 93.1 /100 | #114 | Exceptional 2.4% |
| Immigrants | Hong Kong | 93.1 /100 | #115 | Exceptional 2.4% |
| Northern Europeans | 92.9 /100 | #116 | Exceptional 2.4% |
| Taiwanese | 92.5 /100 | #117 | Exceptional 2.4% |
| Immigrants | Canada | 92.0 /100 | #118 | Exceptional 2.4% |
| Immigrants | Sierra Leone | 91.8 /100 | #119 | Exceptional 2.4% |
| Uruguayans | 91.5 /100 | #120 | Exceptional 2.4% |
| Peruvians | 91.3 /100 | #121 | Exceptional 2.4% |
| Belgians | 90.9 /100 | #122 | Exceptional 2.4% |