Syrian vs Immigrants from Hong Kong Median Household Income
COMPARE
Syrian
Immigrants from Hong Kong
Median Household Income
Median Household Income Comparison
Syrians
Immigrants from Hong Kong
$89,830
MEDIAN HOUSEHOLD INCOME
95.4/ 100
METRIC RATING
118th/ 347
METRIC RANK
$111,519
MEDIAN HOUSEHOLD INCOME
100.0/ 100
METRIC RATING
4th/ 347
METRIC RANK
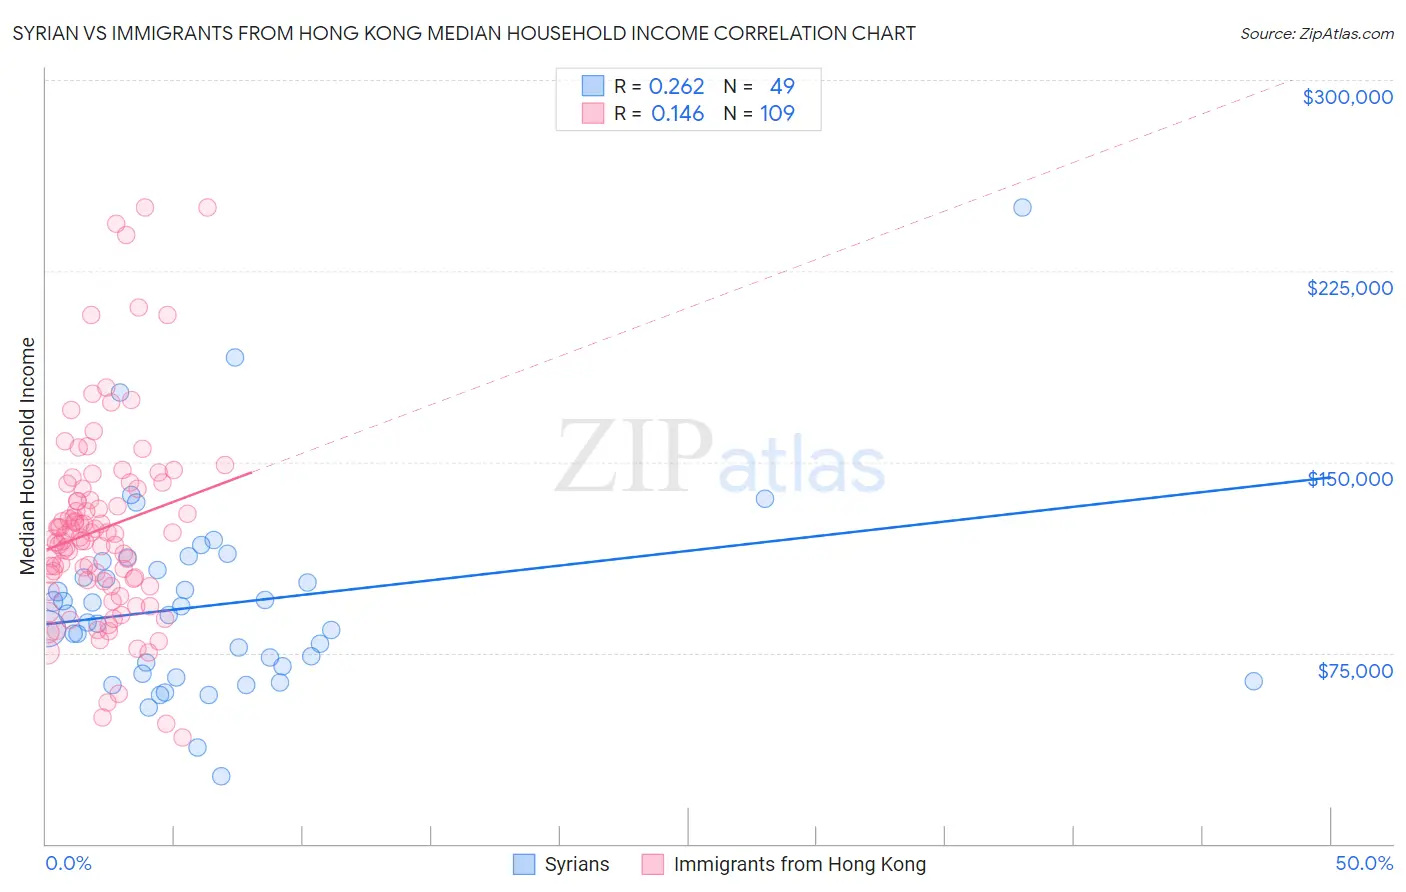
Syrian vs Immigrants from Hong Kong Median Household Income Correlation Chart
The statistical analysis conducted on geographies consisting of 266,119,923 people shows a weak positive correlation between the proportion of Syrians and median household income in the United States with a correlation coefficient (R) of 0.262 and weighted average of $89,830. Similarly, the statistical analysis conducted on geographies consisting of 253,858,060 people shows a poor positive correlation between the proportion of Immigrants from Hong Kong and median household income in the United States with a correlation coefficient (R) of 0.146 and weighted average of $111,519, a difference of 24.1%.
Median Household Income Correlation Summary
| Measurement | Syrian | Immigrants from Hong Kong |
| Minimum | $26,364 | $41,563 |
| Maximum | $250,001 | $250,001 |
| Range | $223,637 | $208,438 |
| Mean | $94,106 | $123,651 |
| Median | $89,903 | $120,226 |
| Interquartile 25% (IQ1) | $68,162 | $102,101 |
| Interquartile 75% (IQ3) | $109,343 | $139,539 |
| Interquartile Range (IQR) | $41,181 | $37,437 |
| Standard Deviation (Sample) | $38,336 | $39,253 |
| Standard Deviation (Population) | $37,943 | $39,072 |
Similar Demographics by Median Household Income
Demographics Similar to Syrians by Median Household Income
In terms of median household income, the demographic groups most similar to Syrians are Taiwanese ($89,900, a difference of 0.080%), Native Hawaiian ($89,919, a difference of 0.10%), Albanian ($89,744, a difference of 0.10%), Immigrants from North Macedonia ($89,741, a difference of 0.10%), and Immigrants from Western Asia ($90,005, a difference of 0.19%).
| Demographics | Rating | Rank | Median Household Income |
| Immigrants | Poland | 97.1 /100 | #111 | Exceptional $90,549 |
| Northern Europeans | 96.9 /100 | #112 | Exceptional $90,446 |
| Peruvians | 96.5 /100 | #113 | Exceptional $90,261 |
| Immigrants | Northern Africa | 95.9 /100 | #114 | Exceptional $90,026 |
| Immigrants | Western Asia | 95.9 /100 | #115 | Exceptional $90,005 |
| Native Hawaiians | 95.7 /100 | #116 | Exceptional $89,919 |
| Taiwanese | 95.6 /100 | #117 | Exceptional $89,900 |
| Syrians | 95.4 /100 | #118 | Exceptional $89,830 |
| Albanians | 95.2 /100 | #119 | Exceptional $89,744 |
| Immigrants | North Macedonia | 95.2 /100 | #120 | Exceptional $89,741 |
| Ethiopians | 94.9 /100 | #121 | Exceptional $89,640 |
| Pakistanis | 94.8 /100 | #122 | Exceptional $89,638 |
| Immigrants | Zimbabwe | 94.4 /100 | #123 | Exceptional $89,496 |
| Immigrants | Jordan | 94.1 /100 | #124 | Exceptional $89,412 |
| Immigrants | Kuwait | 93.5 /100 | #125 | Exceptional $89,263 |
Demographics Similar to Immigrants from Hong Kong by Median Household Income
In terms of median household income, the demographic groups most similar to Immigrants from Hong Kong are Thai ($110,648, a difference of 0.79%), Immigrants from Singapore ($110,428, a difference of 0.99%), Immigrants from India ($113,009, a difference of 1.3%), Iranian ($109,835, a difference of 1.5%), and Immigrants from Iran ($108,055, a difference of 3.2%).
| Demographics | Rating | Rank | Median Household Income |
| Immigrants | Taiwan | 100.0 /100 | #1 | Exceptional $116,460 |
| Filipinos | 100.0 /100 | #2 | Exceptional $115,509 |
| Immigrants | India | 100.0 /100 | #3 | Exceptional $113,009 |
| Immigrants | Hong Kong | 100.0 /100 | #4 | Exceptional $111,519 |
| Thais | 100.0 /100 | #5 | Exceptional $110,648 |
| Immigrants | Singapore | 100.0 /100 | #6 | Exceptional $110,428 |
| Iranians | 100.0 /100 | #7 | Exceptional $109,835 |
| Immigrants | Iran | 100.0 /100 | #8 | Exceptional $108,055 |
| Okinawans | 100.0 /100 | #9 | Exceptional $106,624 |
| Immigrants | South Central Asia | 100.0 /100 | #10 | Exceptional $106,057 |
| Immigrants | China | 100.0 /100 | #11 | Exceptional $105,335 |
| Indians (Asian) | 100.0 /100 | #12 | Exceptional $105,262 |
| Immigrants | Eastern Asia | 100.0 /100 | #13 | Exceptional $104,796 |
| Immigrants | Ireland | 100.0 /100 | #14 | Exceptional $104,692 |
| Immigrants | Israel | 100.0 /100 | #15 | Exceptional $104,090 |