Argentinean vs Immigrants from Hong Kong Median Household Income
COMPARE
Argentinean
Immigrants from Hong Kong
Median Household Income
Median Household Income Comparison
Argentineans
Immigrants from Hong Kong
$93,960
MEDIAN HOUSEHOLD INCOME
99.7/ 100
METRIC RATING
69th/ 347
METRIC RANK
$111,519
MEDIAN HOUSEHOLD INCOME
100.0/ 100
METRIC RATING
4th/ 347
METRIC RANK
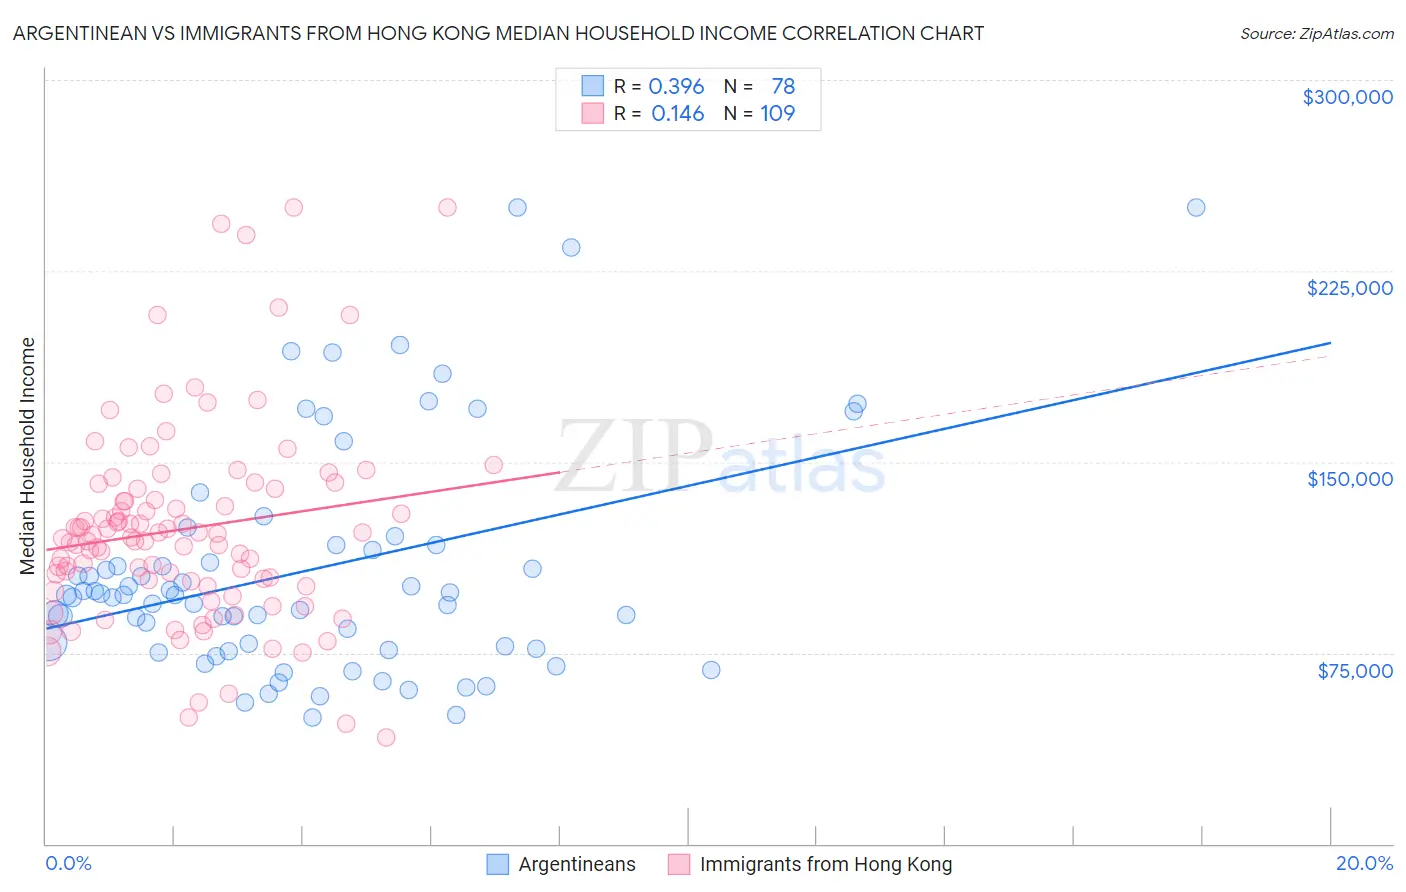
Argentinean vs Immigrants from Hong Kong Median Household Income Correlation Chart
The statistical analysis conducted on geographies consisting of 296,944,042 people shows a mild positive correlation between the proportion of Argentineans and median household income in the United States with a correlation coefficient (R) of 0.396 and weighted average of $93,960. Similarly, the statistical analysis conducted on geographies consisting of 253,858,060 people shows a poor positive correlation between the proportion of Immigrants from Hong Kong and median household income in the United States with a correlation coefficient (R) of 0.146 and weighted average of $111,519, a difference of 18.7%.
Median Household Income Correlation Summary
| Measurement | Argentinean | Immigrants from Hong Kong |
| Minimum | $49,375 | $41,563 |
| Maximum | $250,001 | $250,001 |
| Range | $200,626 | $208,438 |
| Mean | $107,782 | $123,651 |
| Median | $97,608 | $120,226 |
| Interquartile 25% (IQ1) | $76,750 | $102,101 |
| Interquartile 75% (IQ3) | $117,422 | $139,539 |
| Interquartile Range (IQR) | $40,672 | $37,437 |
| Standard Deviation (Sample) | $45,385 | $39,253 |
| Standard Deviation (Population) | $45,093 | $39,072 |
Similar Demographics by Median Household Income
Demographics Similar to Argentineans by Median Household Income
In terms of median household income, the demographic groups most similar to Argentineans are Mongolian ($93,971, a difference of 0.010%), Immigrants from Fiji ($93,933, a difference of 0.030%), Immigrants from Philippines ($93,899, a difference of 0.070%), Lithuanian ($93,852, a difference of 0.11%), and Immigrants from Scotland ($94,091, a difference of 0.14%).
| Demographics | Rating | Rank | Median Household Income |
| Immigrants | Norway | 99.8 /100 | #62 | Exceptional $94,846 |
| Greeks | 99.8 /100 | #63 | Exceptional $94,735 |
| Immigrants | Netherlands | 99.7 /100 | #64 | Exceptional $94,411 |
| Immigrants | Belarus | 99.7 /100 | #65 | Exceptional $94,399 |
| Immigrants | Romania | 99.7 /100 | #66 | Exceptional $94,222 |
| Immigrants | Scotland | 99.7 /100 | #67 | Exceptional $94,091 |
| Mongolians | 99.7 /100 | #68 | Exceptional $93,971 |
| Argentineans | 99.7 /100 | #69 | Exceptional $93,960 |
| Immigrants | Fiji | 99.7 /100 | #70 | Exceptional $93,933 |
| Immigrants | Philippines | 99.6 /100 | #71 | Exceptional $93,899 |
| Lithuanians | 99.6 /100 | #72 | Exceptional $93,852 |
| Immigrants | Egypt | 99.6 /100 | #73 | Exceptional $93,700 |
| Immigrants | Latvia | 99.6 /100 | #74 | Exceptional $93,602 |
| Immigrants | Italy | 99.5 /100 | #75 | Exceptional $93,465 |
| South Africans | 99.5 /100 | #76 | Exceptional $93,379 |
Demographics Similar to Immigrants from Hong Kong by Median Household Income
In terms of median household income, the demographic groups most similar to Immigrants from Hong Kong are Thai ($110,648, a difference of 0.79%), Immigrants from Singapore ($110,428, a difference of 0.99%), Immigrants from India ($113,009, a difference of 1.3%), Iranian ($109,835, a difference of 1.5%), and Immigrants from Iran ($108,055, a difference of 3.2%).
| Demographics | Rating | Rank | Median Household Income |
| Immigrants | Taiwan | 100.0 /100 | #1 | Exceptional $116,460 |
| Filipinos | 100.0 /100 | #2 | Exceptional $115,509 |
| Immigrants | India | 100.0 /100 | #3 | Exceptional $113,009 |
| Immigrants | Hong Kong | 100.0 /100 | #4 | Exceptional $111,519 |
| Thais | 100.0 /100 | #5 | Exceptional $110,648 |
| Immigrants | Singapore | 100.0 /100 | #6 | Exceptional $110,428 |
| Iranians | 100.0 /100 | #7 | Exceptional $109,835 |
| Immigrants | Iran | 100.0 /100 | #8 | Exceptional $108,055 |
| Okinawans | 100.0 /100 | #9 | Exceptional $106,624 |
| Immigrants | South Central Asia | 100.0 /100 | #10 | Exceptional $106,057 |
| Immigrants | China | 100.0 /100 | #11 | Exceptional $105,335 |
| Indians (Asian) | 100.0 /100 | #12 | Exceptional $105,262 |
| Immigrants | Eastern Asia | 100.0 /100 | #13 | Exceptional $104,796 |
| Immigrants | Ireland | 100.0 /100 | #14 | Exceptional $104,692 |
| Immigrants | Israel | 100.0 /100 | #15 | Exceptional $104,090 |