African vs Immigrants from Hong Kong Divorced or Separated
COMPARE
African
Immigrants from Hong Kong
Divorced or Separated
Divorced or Separated Comparison
Africans
Immigrants from Hong Kong
13.2%
DIVORCED OR SEPARATED
0.0/ 100
METRIC RATING
310th/ 347
METRIC RANK
10.0%
DIVORCED OR SEPARATED
100.0/ 100
METRIC RATING
3rd/ 347
METRIC RANK
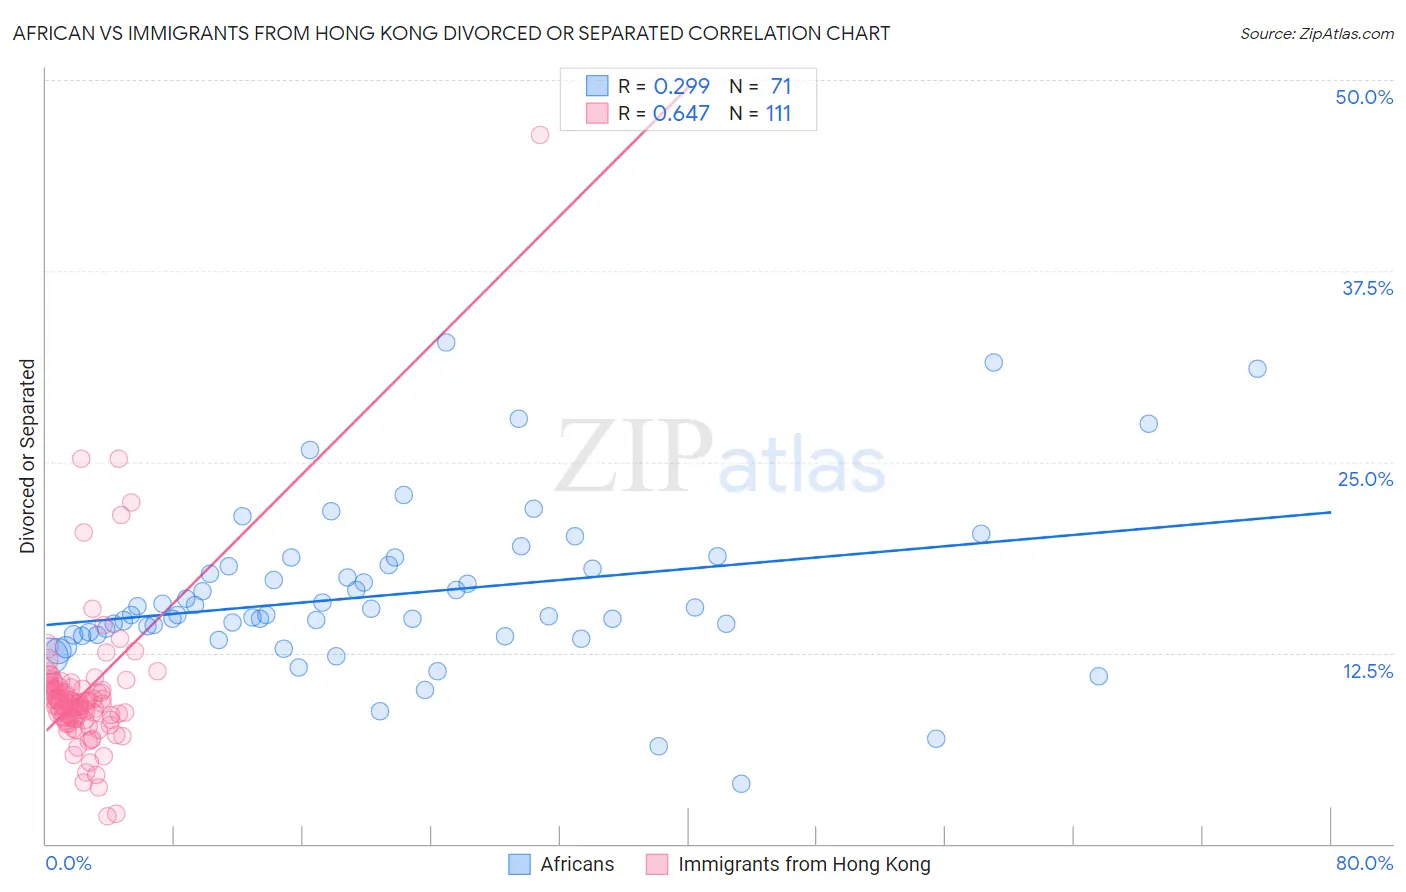
African vs Immigrants from Hong Kong Divorced or Separated Correlation Chart
The statistical analysis conducted on geographies consisting of 469,800,518 people shows a weak positive correlation between the proportion of Africans and percentage of population currently divorced or separated in the United States with a correlation coefficient (R) of 0.299 and weighted average of 13.2%. Similarly, the statistical analysis conducted on geographies consisting of 253,935,113 people shows a significant positive correlation between the proportion of Immigrants from Hong Kong and percentage of population currently divorced or separated in the United States with a correlation coefficient (R) of 0.647 and weighted average of 10.0%, a difference of 32.8%.
Divorced or Separated Correlation Summary
| Measurement | African | Immigrants from Hong Kong |
| Minimum | 3.9% | 1.8% |
| Maximum | 32.8% | 46.4% |
| Range | 28.9% | 44.6% |
| Mean | 16.3% | 9.9% |
| Median | 15.0% | 9.2% |
| Interquartile 25% (IQ1) | 13.7% | 8.2% |
| Interquartile 75% (IQ3) | 18.1% | 10.2% |
| Interquartile Range (IQR) | 4.4% | 2.0% |
| Standard Deviation (Sample) | 5.3% | 5.0% |
| Standard Deviation (Population) | 5.3% | 5.0% |
Similar Demographics by Divorced or Separated
Demographics Similar to Africans by Divorced or Separated
In terms of divorced or separated, the demographic groups most similar to Africans are American (13.2%, a difference of 0.020%), Sioux (13.2%, a difference of 0.020%), Ottawa (13.2%, a difference of 0.030%), French American Indian (13.2%, a difference of 0.12%), and Blackfeet (13.3%, a difference of 0.37%).
| Demographics | Rating | Rank | Divorced or Separated |
| Cape Verdeans | 0.0 /100 | #303 | Tragic 13.1% |
| Hopi | 0.0 /100 | #304 | Tragic 13.2% |
| Chippewa | 0.0 /100 | #305 | Tragic 13.2% |
| Tlingit-Haida | 0.0 /100 | #306 | Tragic 13.2% |
| French American Indians | 0.0 /100 | #307 | Tragic 13.2% |
| Ottawa | 0.0 /100 | #308 | Tragic 13.2% |
| Americans | 0.0 /100 | #309 | Tragic 13.2% |
| Africans | 0.0 /100 | #310 | Tragic 13.2% |
| Sioux | 0.0 /100 | #311 | Tragic 13.2% |
| Blackfeet | 0.0 /100 | #312 | Tragic 13.3% |
| Immigrants | Nicaragua | 0.0 /100 | #313 | Tragic 13.3% |
| Yaqui | 0.0 /100 | #314 | Tragic 13.3% |
| Spanish Americans | 0.0 /100 | #315 | Tragic 13.3% |
| Tsimshian | 0.0 /100 | #316 | Tragic 13.3% |
| Haitians | 0.0 /100 | #317 | Tragic 13.3% |
Demographics Similar to Immigrants from Hong Kong by Divorced or Separated
In terms of divorced or separated, the demographic groups most similar to Immigrants from Hong Kong are Filipino (9.9%, a difference of 0.56%), Immigrants from China (10.0%, a difference of 0.72%), Immigrants from India (10.1%, a difference of 0.96%), Immigrants from Taiwan (9.8%, a difference of 1.6%), and Indian (Asian) (10.2%, a difference of 2.3%).
| Demographics | Rating | Rank | Divorced or Separated |
| Immigrants | Taiwan | 100.0 /100 | #1 | Exceptional 9.8% |
| Filipinos | 100.0 /100 | #2 | Exceptional 9.9% |
| Immigrants | Hong Kong | 100.0 /100 | #3 | Exceptional 10.0% |
| Immigrants | China | 100.0 /100 | #4 | Exceptional 10.0% |
| Immigrants | India | 100.0 /100 | #5 | Exceptional 10.1% |
| Indians (Asian) | 100.0 /100 | #6 | Exceptional 10.2% |
| Thais | 100.0 /100 | #7 | Exceptional 10.2% |
| Immigrants | Eastern Asia | 100.0 /100 | #8 | Exceptional 10.2% |
| Yup'ik | 100.0 /100 | #9 | Exceptional 10.3% |
| Immigrants | Singapore | 100.0 /100 | #10 | Exceptional 10.3% |
| Immigrants | South Central Asia | 100.0 /100 | #11 | Exceptional 10.4% |
| Okinawans | 100.0 /100 | #12 | Exceptional 10.5% |
| Cypriots | 100.0 /100 | #13 | Exceptional 10.5% |
| Assyrians/Chaldeans/Syriacs | 100.0 /100 | #14 | Exceptional 10.6% |
| Immigrants | Armenia | 100.0 /100 | #15 | Exceptional 10.6% |