British vs Immigrants from Hong Kong Median Household Income
COMPARE
British
Immigrants from Hong Kong
Median Household Income
Median Household Income Comparison
British
Immigrants from Hong Kong
$88,914
MEDIAN HOUSEHOLD INCOME
92.0/ 100
METRIC RATING
130th/ 347
METRIC RANK
$111,519
MEDIAN HOUSEHOLD INCOME
100.0/ 100
METRIC RATING
4th/ 347
METRIC RANK
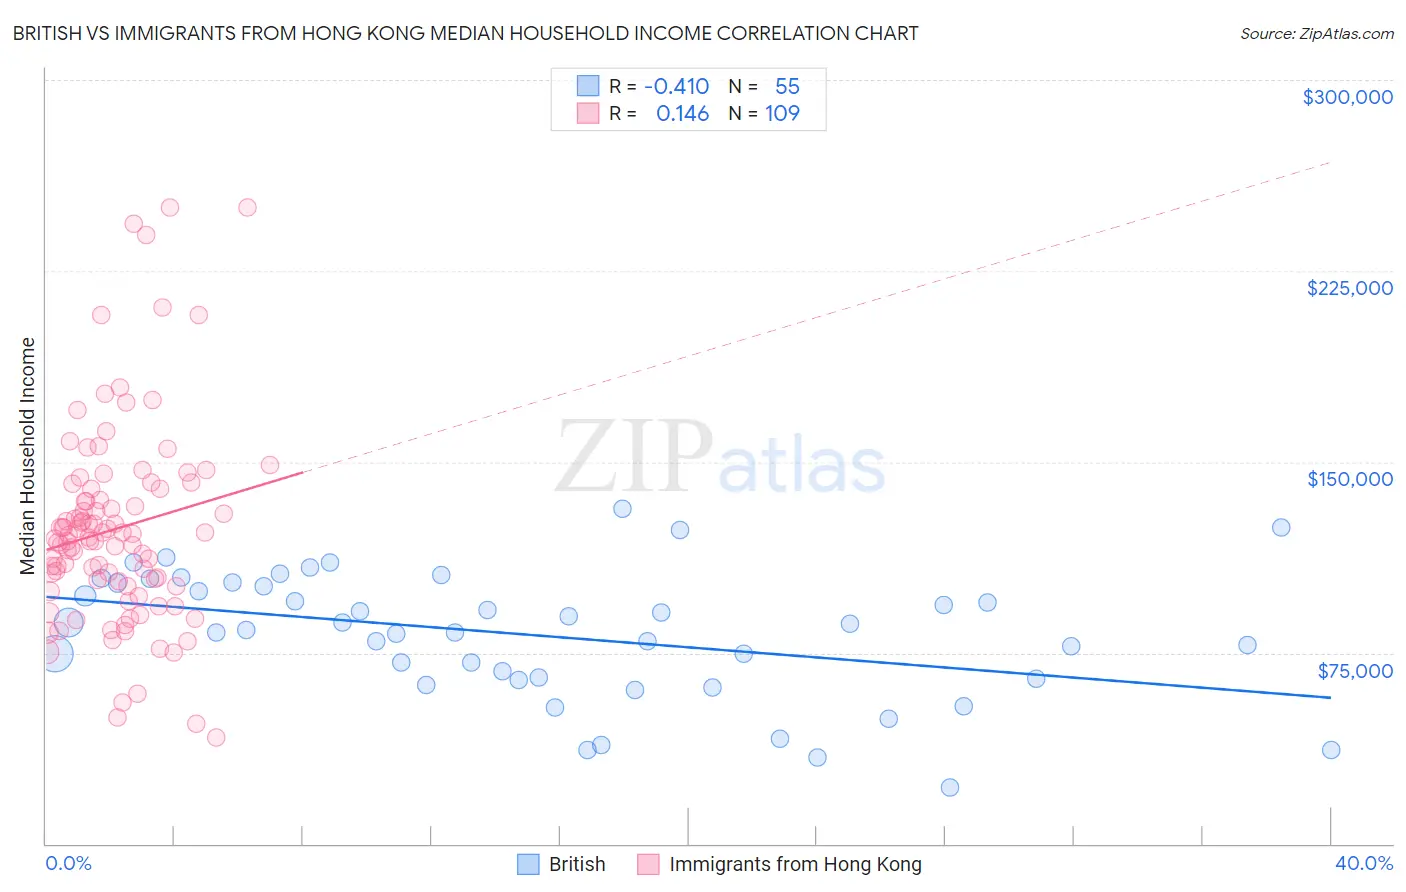
British vs Immigrants from Hong Kong Median Household Income Correlation Chart
The statistical analysis conducted on geographies consisting of 530,799,157 people shows a moderate negative correlation between the proportion of British and median household income in the United States with a correlation coefficient (R) of -0.410 and weighted average of $88,914. Similarly, the statistical analysis conducted on geographies consisting of 253,858,060 people shows a poor positive correlation between the proportion of Immigrants from Hong Kong and median household income in the United States with a correlation coefficient (R) of 0.146 and weighted average of $111,519, a difference of 25.4%.
Median Household Income Correlation Summary
| Measurement | British | Immigrants from Hong Kong |
| Minimum | $21,968 | $41,563 |
| Maximum | $131,817 | $250,001 |
| Range | $109,849 | $208,438 |
| Mean | $81,960 | $123,651 |
| Median | $83,896 | $120,226 |
| Interquartile 25% (IQ1) | $64,868 | $102,101 |
| Interquartile 75% (IQ3) | $102,423 | $139,539 |
| Interquartile Range (IQR) | $37,555 | $37,437 |
| Standard Deviation (Sample) | $24,875 | $39,253 |
| Standard Deviation (Population) | $24,648 | $39,072 |
Similar Demographics by Median Household Income
Demographics Similar to British by Median Household Income
In terms of median household income, the demographic groups most similar to British are Brazilian ($88,934, a difference of 0.020%), Portuguese ($88,976, a difference of 0.070%), Immigrants from Peru ($89,010, a difference of 0.11%), Immigrants from Syria ($88,792, a difference of 0.14%), and European ($88,751, a difference of 0.18%).
| Demographics | Rating | Rank | Median Household Income |
| Immigrants | Zimbabwe | 94.4 /100 | #123 | Exceptional $89,496 |
| Immigrants | Jordan | 94.1 /100 | #124 | Exceptional $89,412 |
| Immigrants | Kuwait | 93.5 /100 | #125 | Exceptional $89,263 |
| Immigrants | Oceania | 92.9 /100 | #126 | Exceptional $89,100 |
| Immigrants | Peru | 92.5 /100 | #127 | Exceptional $89,010 |
| Portuguese | 92.3 /100 | #128 | Exceptional $88,976 |
| Brazilians | 92.1 /100 | #129 | Exceptional $88,934 |
| British | 92.0 /100 | #130 | Exceptional $88,914 |
| Immigrants | Syria | 91.4 /100 | #131 | Exceptional $88,792 |
| Europeans | 91.2 /100 | #132 | Exceptional $88,751 |
| Immigrants | Ethiopia | 90.9 /100 | #133 | Exceptional $88,687 |
| Swedes | 90.0 /100 | #134 | Exceptional $88,524 |
| Immigrants | Sierra Leone | 89.9 /100 | #135 | Excellent $88,498 |
| Poles | 89.7 /100 | #136 | Excellent $88,472 |
| Sierra Leoneans | 89.6 /100 | #137 | Excellent $88,463 |
Demographics Similar to Immigrants from Hong Kong by Median Household Income
In terms of median household income, the demographic groups most similar to Immigrants from Hong Kong are Thai ($110,648, a difference of 0.79%), Immigrants from Singapore ($110,428, a difference of 0.99%), Immigrants from India ($113,009, a difference of 1.3%), Iranian ($109,835, a difference of 1.5%), and Immigrants from Iran ($108,055, a difference of 3.2%).
| Demographics | Rating | Rank | Median Household Income |
| Immigrants | Taiwan | 100.0 /100 | #1 | Exceptional $116,460 |
| Filipinos | 100.0 /100 | #2 | Exceptional $115,509 |
| Immigrants | India | 100.0 /100 | #3 | Exceptional $113,009 |
| Immigrants | Hong Kong | 100.0 /100 | #4 | Exceptional $111,519 |
| Thais | 100.0 /100 | #5 | Exceptional $110,648 |
| Immigrants | Singapore | 100.0 /100 | #6 | Exceptional $110,428 |
| Iranians | 100.0 /100 | #7 | Exceptional $109,835 |
| Immigrants | Iran | 100.0 /100 | #8 | Exceptional $108,055 |
| Okinawans | 100.0 /100 | #9 | Exceptional $106,624 |
| Immigrants | South Central Asia | 100.0 /100 | #10 | Exceptional $106,057 |
| Immigrants | China | 100.0 /100 | #11 | Exceptional $105,335 |
| Indians (Asian) | 100.0 /100 | #12 | Exceptional $105,262 |
| Immigrants | Eastern Asia | 100.0 /100 | #13 | Exceptional $104,796 |
| Immigrants | Ireland | 100.0 /100 | #14 | Exceptional $104,692 |
| Immigrants | Israel | 100.0 /100 | #15 | Exceptional $104,090 |