African vs Immigrants from North Macedonia Median Household Income
COMPARE
African
Immigrants from North Macedonia
Median Household Income
Median Household Income Comparison
Africans
Immigrants from North Macedonia
$72,650
MEDIAN HOUSEHOLD INCOME
0.0/ 100
METRIC RATING
303rd/ 347
METRIC RANK
$89,741
MEDIAN HOUSEHOLD INCOME
95.2/ 100
METRIC RATING
120th/ 347
METRIC RANK
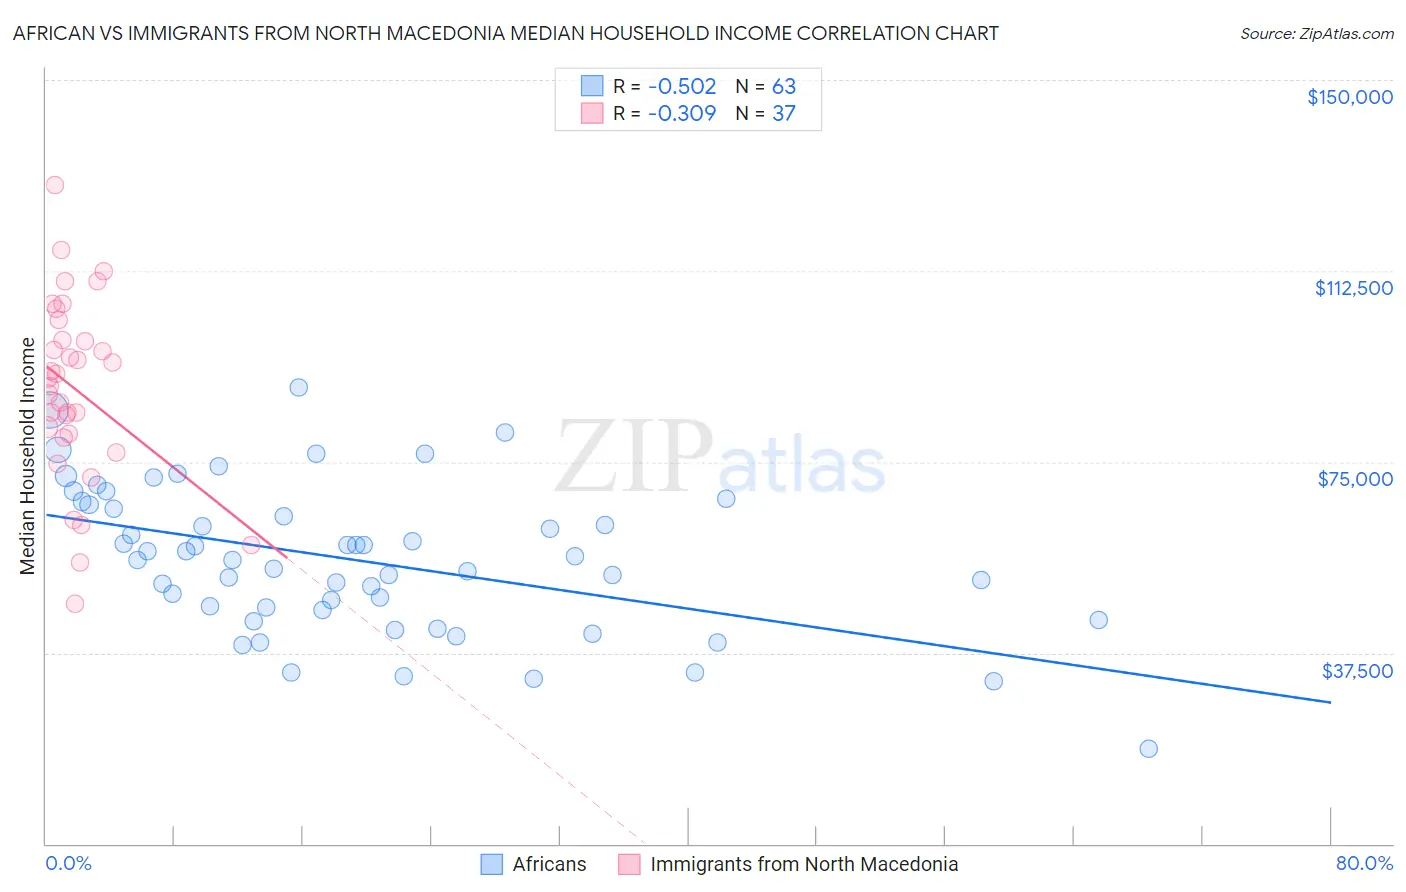
African vs Immigrants from North Macedonia Median Household Income Correlation Chart
The statistical analysis conducted on geographies consisting of 469,417,783 people shows a substantial negative correlation between the proportion of Africans and median household income in the United States with a correlation coefficient (R) of -0.502 and weighted average of $72,650. Similarly, the statistical analysis conducted on geographies consisting of 74,304,962 people shows a mild negative correlation between the proportion of Immigrants from North Macedonia and median household income in the United States with a correlation coefficient (R) of -0.309 and weighted average of $89,741, a difference of 23.5%.
Median Household Income Correlation Summary
| Measurement | African | Immigrants from North Macedonia |
| Minimum | $18,750 | $47,094 |
| Maximum | $89,652 | $129,437 |
| Range | $70,902 | $82,343 |
| Mean | $55,711 | $89,408 |
| Median | $55,621 | $91,504 |
| Interquartile 25% (IQ1) | $45,960 | $80,151 |
| Interquartile 75% (IQ3) | $66,633 | $100,949 |
| Interquartile Range (IQR) | $20,673 | $20,798 |
| Standard Deviation (Sample) | $14,453 | $17,826 |
| Standard Deviation (Population) | $14,338 | $17,584 |
Similar Demographics by Median Household Income
Demographics Similar to Africans by Median Household Income
In terms of median household income, the demographic groups most similar to Africans are Shoshone ($72,660, a difference of 0.010%), Cherokee ($72,682, a difference of 0.040%), Immigrants from Haiti ($72,599, a difference of 0.070%), Honduran ($72,588, a difference of 0.090%), and Potawatomi ($72,576, a difference of 0.10%).
| Demographics | Rating | Rank | Median Household Income |
| Haitians | 0.1 /100 | #296 | Tragic $73,306 |
| Immigrants | Mexico | 0.0 /100 | #297 | Tragic $73,160 |
| Paiute | 0.0 /100 | #298 | Tragic $72,959 |
| Indonesians | 0.0 /100 | #299 | Tragic $72,856 |
| Immigrants | Dominica | 0.0 /100 | #300 | Tragic $72,760 |
| Cherokee | 0.0 /100 | #301 | Tragic $72,682 |
| Shoshone | 0.0 /100 | #302 | Tragic $72,660 |
| Africans | 0.0 /100 | #303 | Tragic $72,650 |
| Immigrants | Haiti | 0.0 /100 | #304 | Tragic $72,599 |
| Hondurans | 0.0 /100 | #305 | Tragic $72,588 |
| Potawatomi | 0.0 /100 | #306 | Tragic $72,576 |
| Ute | 0.0 /100 | #307 | Tragic $72,402 |
| Yakama | 0.0 /100 | #308 | Tragic $72,225 |
| Immigrants | Caribbean | 0.0 /100 | #309 | Tragic $71,860 |
| U.S. Virgin Islanders | 0.0 /100 | #310 | Tragic $71,853 |
Demographics Similar to Immigrants from North Macedonia by Median Household Income
In terms of median household income, the demographic groups most similar to Immigrants from North Macedonia are Albanian ($89,744, a difference of 0.0%), Syrian ($89,830, a difference of 0.10%), Ethiopian ($89,640, a difference of 0.11%), Pakistani ($89,638, a difference of 0.11%), and Taiwanese ($89,900, a difference of 0.18%).
| Demographics | Rating | Rank | Median Household Income |
| Peruvians | 96.5 /100 | #113 | Exceptional $90,261 |
| Immigrants | Northern Africa | 95.9 /100 | #114 | Exceptional $90,026 |
| Immigrants | Western Asia | 95.9 /100 | #115 | Exceptional $90,005 |
| Native Hawaiians | 95.7 /100 | #116 | Exceptional $89,919 |
| Taiwanese | 95.6 /100 | #117 | Exceptional $89,900 |
| Syrians | 95.4 /100 | #118 | Exceptional $89,830 |
| Albanians | 95.2 /100 | #119 | Exceptional $89,744 |
| Immigrants | North Macedonia | 95.2 /100 | #120 | Exceptional $89,741 |
| Ethiopians | 94.9 /100 | #121 | Exceptional $89,640 |
| Pakistanis | 94.8 /100 | #122 | Exceptional $89,638 |
| Immigrants | Zimbabwe | 94.4 /100 | #123 | Exceptional $89,496 |
| Immigrants | Jordan | 94.1 /100 | #124 | Exceptional $89,412 |
| Immigrants | Kuwait | 93.5 /100 | #125 | Exceptional $89,263 |
| Immigrants | Oceania | 92.9 /100 | #126 | Exceptional $89,100 |
| Immigrants | Peru | 92.5 /100 | #127 | Exceptional $89,010 |