African vs Cree Median Household Income
COMPARE
African
Cree
Median Household Income
Median Household Income Comparison
Africans
Cree
$72,650
MEDIAN HOUSEHOLD INCOME
0.0/ 100
METRIC RATING
303rd/ 347
METRIC RANK
$74,685
MEDIAN HOUSEHOLD INCOME
0.1/ 100
METRIC RATING
283rd/ 347
METRIC RANK
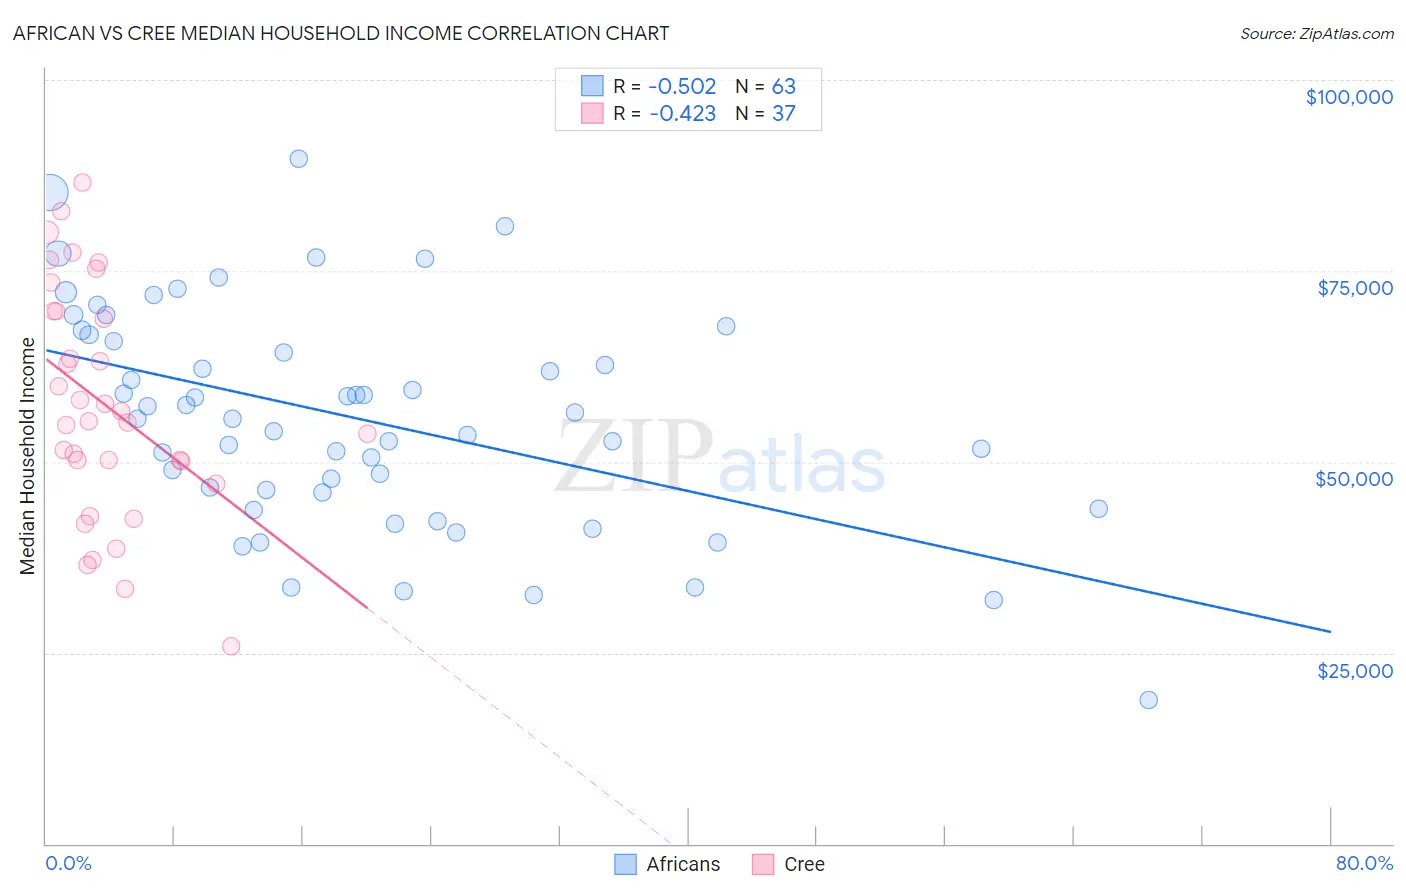
African vs Cree Median Household Income Correlation Chart
The statistical analysis conducted on geographies consisting of 469,417,783 people shows a substantial negative correlation between the proportion of Africans and median household income in the United States with a correlation coefficient (R) of -0.502 and weighted average of $72,650. Similarly, the statistical analysis conducted on geographies consisting of 76,206,119 people shows a moderate negative correlation between the proportion of Cree and median household income in the United States with a correlation coefficient (R) of -0.423 and weighted average of $74,685, a difference of 2.8%.
Median Household Income Correlation Summary
| Measurement | African | Cree |
| Minimum | $18,750 | $25,833 |
| Maximum | $89,652 | $86,509 |
| Range | $70,902 | $60,676 |
| Mean | $55,711 | $57,468 |
| Median | $55,621 | $55,368 |
| Interquartile 25% (IQ1) | $45,960 | $48,609 |
| Interquartile 75% (IQ3) | $66,633 | $69,690 |
| Interquartile Range (IQR) | $20,673 | $21,081 |
| Standard Deviation (Sample) | $14,453 | $14,992 |
| Standard Deviation (Population) | $14,338 | $14,788 |
Demographics Similar to Africans and Cree by Median Household Income
In terms of median household income, the demographic groups most similar to Africans are Shoshone ($72,660, a difference of 0.010%), Cherokee ($72,682, a difference of 0.040%), Immigrants from Dominica ($72,760, a difference of 0.15%), Indonesian ($72,856, a difference of 0.28%), and Paiute ($72,959, a difference of 0.43%). Similarly, the demographic groups most similar to Cree are Yaqui ($74,596, a difference of 0.12%), Mexican ($74,399, a difference of 0.39%), Immigrants from Somalia ($74,300, a difference of 0.52%), Iroquois ($74,279, a difference of 0.55%), and Immigrants from Central America ($74,217, a difference of 0.63%).
| Demographics | Rating | Rank | Median Household Income |
| Cree | 0.1 /100 | #283 | Tragic $74,685 |
| Yaqui | 0.1 /100 | #284 | Tragic $74,596 |
| Mexicans | 0.1 /100 | #285 | Tragic $74,399 |
| Immigrants | Somalia | 0.1 /100 | #286 | Tragic $74,300 |
| Iroquois | 0.1 /100 | #287 | Tragic $74,279 |
| Immigrants | Central America | 0.1 /100 | #288 | Tragic $74,217 |
| Fijians | 0.1 /100 | #289 | Tragic $74,205 |
| Bangladeshis | 0.1 /100 | #290 | Tragic $74,112 |
| Hispanics or Latinos | 0.1 /100 | #291 | Tragic $73,823 |
| Comanche | 0.1 /100 | #292 | Tragic $73,747 |
| Immigrants | Cabo Verde | 0.1 /100 | #293 | Tragic $73,515 |
| Blackfeet | 0.1 /100 | #294 | Tragic $73,509 |
| Cubans | 0.1 /100 | #295 | Tragic $73,392 |
| Haitians | 0.1 /100 | #296 | Tragic $73,306 |
| Immigrants | Mexico | 0.0 /100 | #297 | Tragic $73,160 |
| Paiute | 0.0 /100 | #298 | Tragic $72,959 |
| Indonesians | 0.0 /100 | #299 | Tragic $72,856 |
| Immigrants | Dominica | 0.0 /100 | #300 | Tragic $72,760 |
| Cherokee | 0.0 /100 | #301 | Tragic $72,682 |
| Shoshone | 0.0 /100 | #302 | Tragic $72,660 |
| Africans | 0.0 /100 | #303 | Tragic $72,650 |