African vs Turkish Median Household Income
COMPARE
African
Turkish
Median Household Income
Median Household Income Comparison
Africans
Turks
$72,650
MEDIAN HOUSEHOLD INCOME
0.0/ 100
METRIC RATING
303rd/ 347
METRIC RANK
$99,389
MEDIAN HOUSEHOLD INCOME
100.0/ 100
METRIC RATING
31st/ 347
METRIC RANK
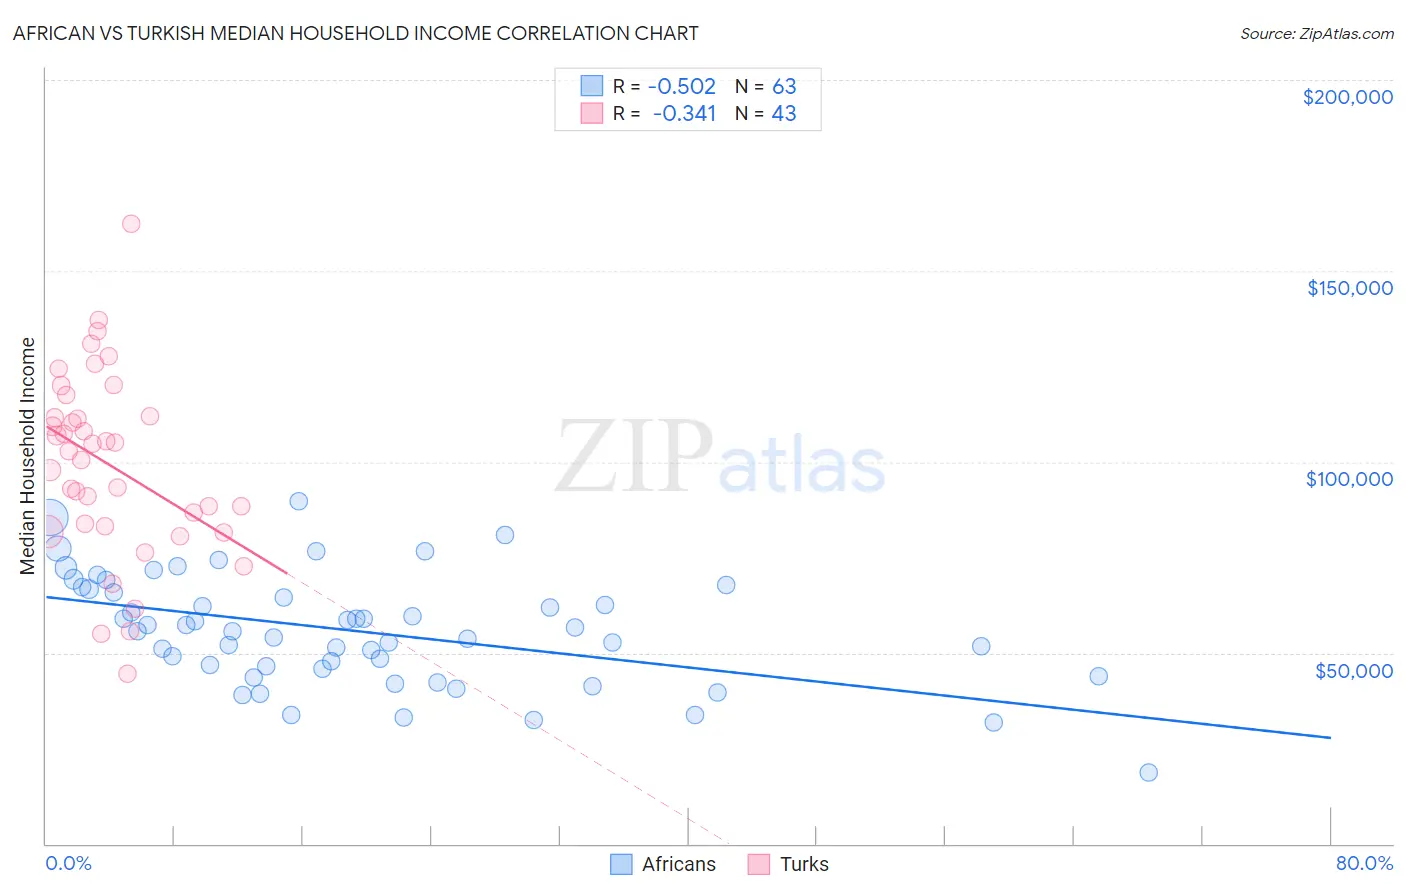
African vs Turkish Median Household Income Correlation Chart
The statistical analysis conducted on geographies consisting of 469,417,783 people shows a substantial negative correlation between the proportion of Africans and median household income in the United States with a correlation coefficient (R) of -0.502 and weighted average of $72,650. Similarly, the statistical analysis conducted on geographies consisting of 271,658,597 people shows a mild negative correlation between the proportion of Turks and median household income in the United States with a correlation coefficient (R) of -0.341 and weighted average of $99,389, a difference of 36.8%.
Median Household Income Correlation Summary
| Measurement | African | Turkish |
| Minimum | $18,750 | $44,531 |
| Maximum | $89,652 | $162,391 |
| Range | $70,902 | $117,860 |
| Mean | $55,711 | $99,338 |
| Median | $55,621 | $102,665 |
| Interquartile 25% (IQ1) | $45,960 | $83,043 |
| Interquartile 75% (IQ3) | $66,633 | $112,097 |
| Interquartile Range (IQR) | $20,673 | $29,054 |
| Standard Deviation (Sample) | $14,453 | $24,163 |
| Standard Deviation (Population) | $14,338 | $23,880 |
Similar Demographics by Median Household Income
Demographics Similar to Africans by Median Household Income
In terms of median household income, the demographic groups most similar to Africans are Shoshone ($72,660, a difference of 0.010%), Cherokee ($72,682, a difference of 0.040%), Immigrants from Haiti ($72,599, a difference of 0.070%), Honduran ($72,588, a difference of 0.090%), and Potawatomi ($72,576, a difference of 0.10%).
| Demographics | Rating | Rank | Median Household Income |
| Haitians | 0.1 /100 | #296 | Tragic $73,306 |
| Immigrants | Mexico | 0.0 /100 | #297 | Tragic $73,160 |
| Paiute | 0.0 /100 | #298 | Tragic $72,959 |
| Indonesians | 0.0 /100 | #299 | Tragic $72,856 |
| Immigrants | Dominica | 0.0 /100 | #300 | Tragic $72,760 |
| Cherokee | 0.0 /100 | #301 | Tragic $72,682 |
| Shoshone | 0.0 /100 | #302 | Tragic $72,660 |
| Africans | 0.0 /100 | #303 | Tragic $72,650 |
| Immigrants | Haiti | 0.0 /100 | #304 | Tragic $72,599 |
| Hondurans | 0.0 /100 | #305 | Tragic $72,588 |
| Potawatomi | 0.0 /100 | #306 | Tragic $72,576 |
| Ute | 0.0 /100 | #307 | Tragic $72,402 |
| Yakama | 0.0 /100 | #308 | Tragic $72,225 |
| Immigrants | Caribbean | 0.0 /100 | #309 | Tragic $71,860 |
| U.S. Virgin Islanders | 0.0 /100 | #310 | Tragic $71,853 |
Demographics Similar to Turks by Median Household Income
In terms of median household income, the demographic groups most similar to Turks are Immigrants from Northern Europe ($99,813, a difference of 0.43%), Immigrants from Asia ($99,933, a difference of 0.55%), Immigrants from Sri Lanka ($99,943, a difference of 0.56%), Bhutanese ($100,151, a difference of 0.77%), and Immigrants from Denmark ($98,510, a difference of 0.89%).
| Demographics | Rating | Rank | Median Household Income |
| Immigrants | Japan | 100.0 /100 | #24 | Exceptional $100,711 |
| Immigrants | Sweden | 100.0 /100 | #25 | Exceptional $100,699 |
| Immigrants | Belgium | 100.0 /100 | #26 | Exceptional $100,306 |
| Bhutanese | 100.0 /100 | #27 | Exceptional $100,151 |
| Immigrants | Sri Lanka | 100.0 /100 | #28 | Exceptional $99,943 |
| Immigrants | Asia | 100.0 /100 | #29 | Exceptional $99,933 |
| Immigrants | Northern Europe | 100.0 /100 | #30 | Exceptional $99,813 |
| Turks | 100.0 /100 | #31 | Exceptional $99,389 |
| Immigrants | Denmark | 100.0 /100 | #32 | Exceptional $98,510 |
| Chinese | 100.0 /100 | #33 | Exceptional $98,496 |
| Russians | 100.0 /100 | #34 | Exceptional $98,008 |
| Immigrants | Switzerland | 100.0 /100 | #35 | Exceptional $97,979 |
| Immigrants | Pakistan | 100.0 /100 | #36 | Exceptional $97,528 |
| Latvians | 100.0 /100 | #37 | Exceptional $97,311 |
| Immigrants | Indonesia | 100.0 /100 | #38 | Exceptional $97,297 |