African vs Immigrants from Eritrea Median Household Income
COMPARE
African
Immigrants from Eritrea
Median Household Income
Median Household Income Comparison
Africans
Immigrants from Eritrea
$72,650
MEDIAN HOUSEHOLD INCOME
0.0/ 100
METRIC RATING
303rd/ 347
METRIC RANK
$85,025
MEDIAN HOUSEHOLD INCOME
48.8/ 100
METRIC RATING
177th/ 347
METRIC RANK
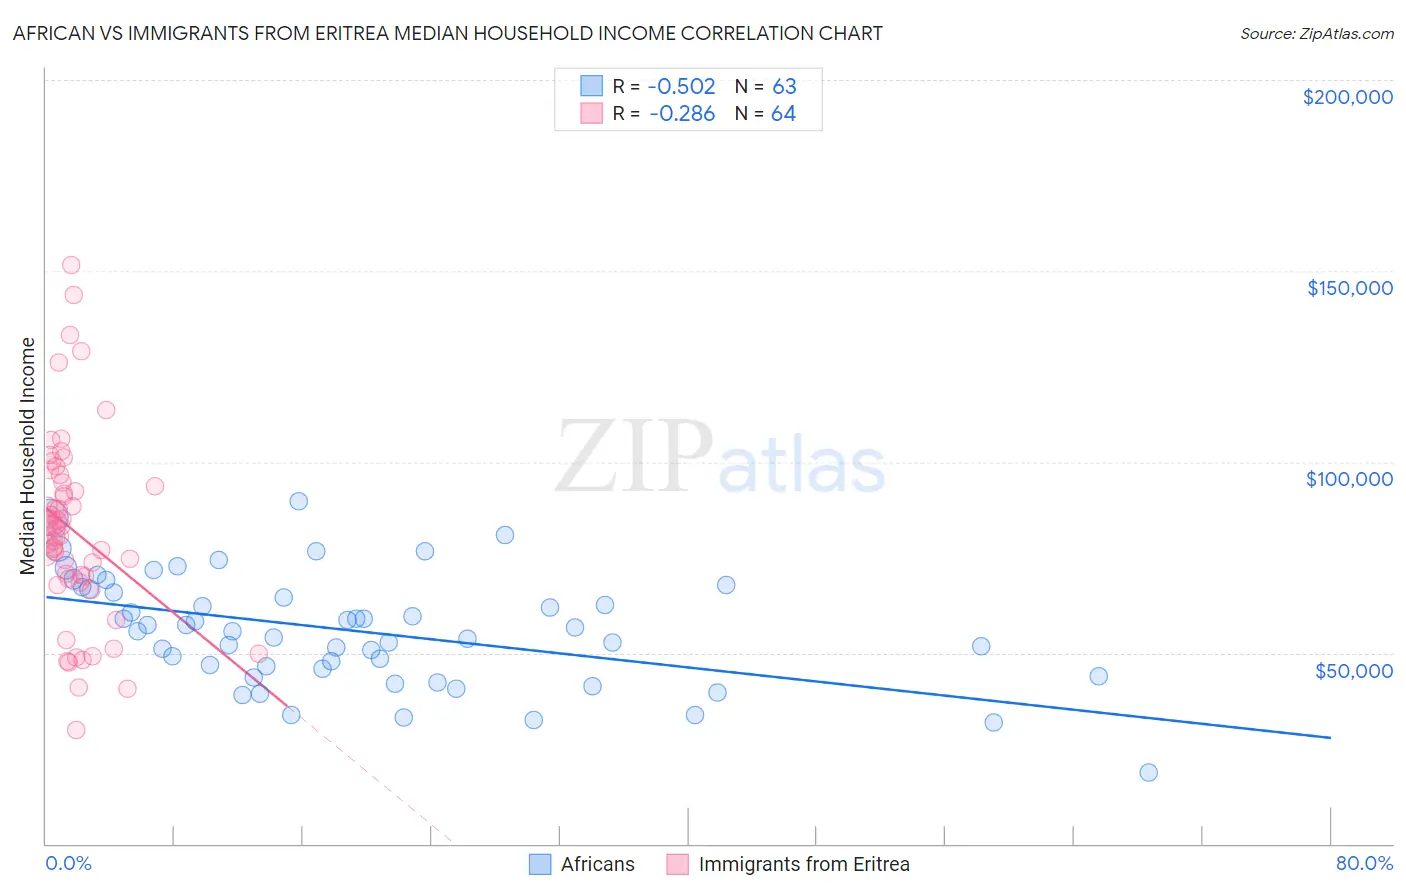
African vs Immigrants from Eritrea Median Household Income Correlation Chart
The statistical analysis conducted on geographies consisting of 469,417,783 people shows a substantial negative correlation between the proportion of Africans and median household income in the United States with a correlation coefficient (R) of -0.502 and weighted average of $72,650. Similarly, the statistical analysis conducted on geographies consisting of 104,846,826 people shows a weak negative correlation between the proportion of Immigrants from Eritrea and median household income in the United States with a correlation coefficient (R) of -0.286 and weighted average of $85,025, a difference of 17.0%.
Median Household Income Correlation Summary
| Measurement | African | Immigrants from Eritrea |
| Minimum | $18,750 | $29,732 |
| Maximum | $89,652 | $151,475 |
| Range | $70,902 | $121,743 |
| Mean | $55,711 | $82,120 |
| Median | $55,621 | $82,729 |
| Interquartile 25% (IQ1) | $45,960 | $69,674 |
| Interquartile 75% (IQ3) | $66,633 | $94,044 |
| Interquartile Range (IQR) | $20,673 | $24,370 |
| Standard Deviation (Sample) | $14,453 | $24,340 |
| Standard Deviation (Population) | $14,338 | $24,149 |
Similar Demographics by Median Household Income
Demographics Similar to Africans by Median Household Income
In terms of median household income, the demographic groups most similar to Africans are Shoshone ($72,660, a difference of 0.010%), Cherokee ($72,682, a difference of 0.040%), Immigrants from Haiti ($72,599, a difference of 0.070%), Honduran ($72,588, a difference of 0.090%), and Potawatomi ($72,576, a difference of 0.10%).
| Demographics | Rating | Rank | Median Household Income |
| Haitians | 0.1 /100 | #296 | Tragic $73,306 |
| Immigrants | Mexico | 0.0 /100 | #297 | Tragic $73,160 |
| Paiute | 0.0 /100 | #298 | Tragic $72,959 |
| Indonesians | 0.0 /100 | #299 | Tragic $72,856 |
| Immigrants | Dominica | 0.0 /100 | #300 | Tragic $72,760 |
| Cherokee | 0.0 /100 | #301 | Tragic $72,682 |
| Shoshone | 0.0 /100 | #302 | Tragic $72,660 |
| Africans | 0.0 /100 | #303 | Tragic $72,650 |
| Immigrants | Haiti | 0.0 /100 | #304 | Tragic $72,599 |
| Hondurans | 0.0 /100 | #305 | Tragic $72,588 |
| Potawatomi | 0.0 /100 | #306 | Tragic $72,576 |
| Ute | 0.0 /100 | #307 | Tragic $72,402 |
| Yakama | 0.0 /100 | #308 | Tragic $72,225 |
| Immigrants | Caribbean | 0.0 /100 | #309 | Tragic $71,860 |
| U.S. Virgin Islanders | 0.0 /100 | #310 | Tragic $71,853 |
Demographics Similar to Immigrants from Eritrea by Median Household Income
In terms of median household income, the demographic groups most similar to Immigrants from Eritrea are Immigrants from Costa Rica ($85,054, a difference of 0.030%), Alsatian ($85,053, a difference of 0.030%), Czechoslovakian ($84,965, a difference of 0.070%), Scottish ($85,101, a difference of 0.090%), and English ($84,915, a difference of 0.13%).
| Demographics | Rating | Rank | Median Household Income |
| Swiss | 59.2 /100 | #170 | Average $85,681 |
| Immigrants | South America | 58.1 /100 | #171 | Average $85,611 |
| Slovenes | 57.4 /100 | #172 | Average $85,562 |
| Immigrants | Cameroon | 53.4 /100 | #173 | Average $85,314 |
| Scottish | 50.0 /100 | #174 | Average $85,101 |
| Immigrants | Costa Rica | 49.2 /100 | #175 | Average $85,054 |
| Alsatians | 49.2 /100 | #176 | Average $85,053 |
| Immigrants | Eritrea | 48.8 /100 | #177 | Average $85,025 |
| Czechoslovakians | 47.8 /100 | #178 | Average $84,965 |
| English | 47.0 /100 | #179 | Average $84,915 |
| Immigrants | Portugal | 44.2 /100 | #180 | Average $84,740 |
| Hawaiians | 44.1 /100 | #181 | Average $84,729 |
| Uruguayans | 43.5 /100 | #182 | Average $84,691 |
| Spaniards | 42.7 /100 | #183 | Average $84,644 |
| Immigrants | Eastern Africa | 37.4 /100 | #184 | Fair $84,299 |